MetaTrader 4 Line Studies Toolbar – Overview
This lesson will cover the following
- Positioning
- Options
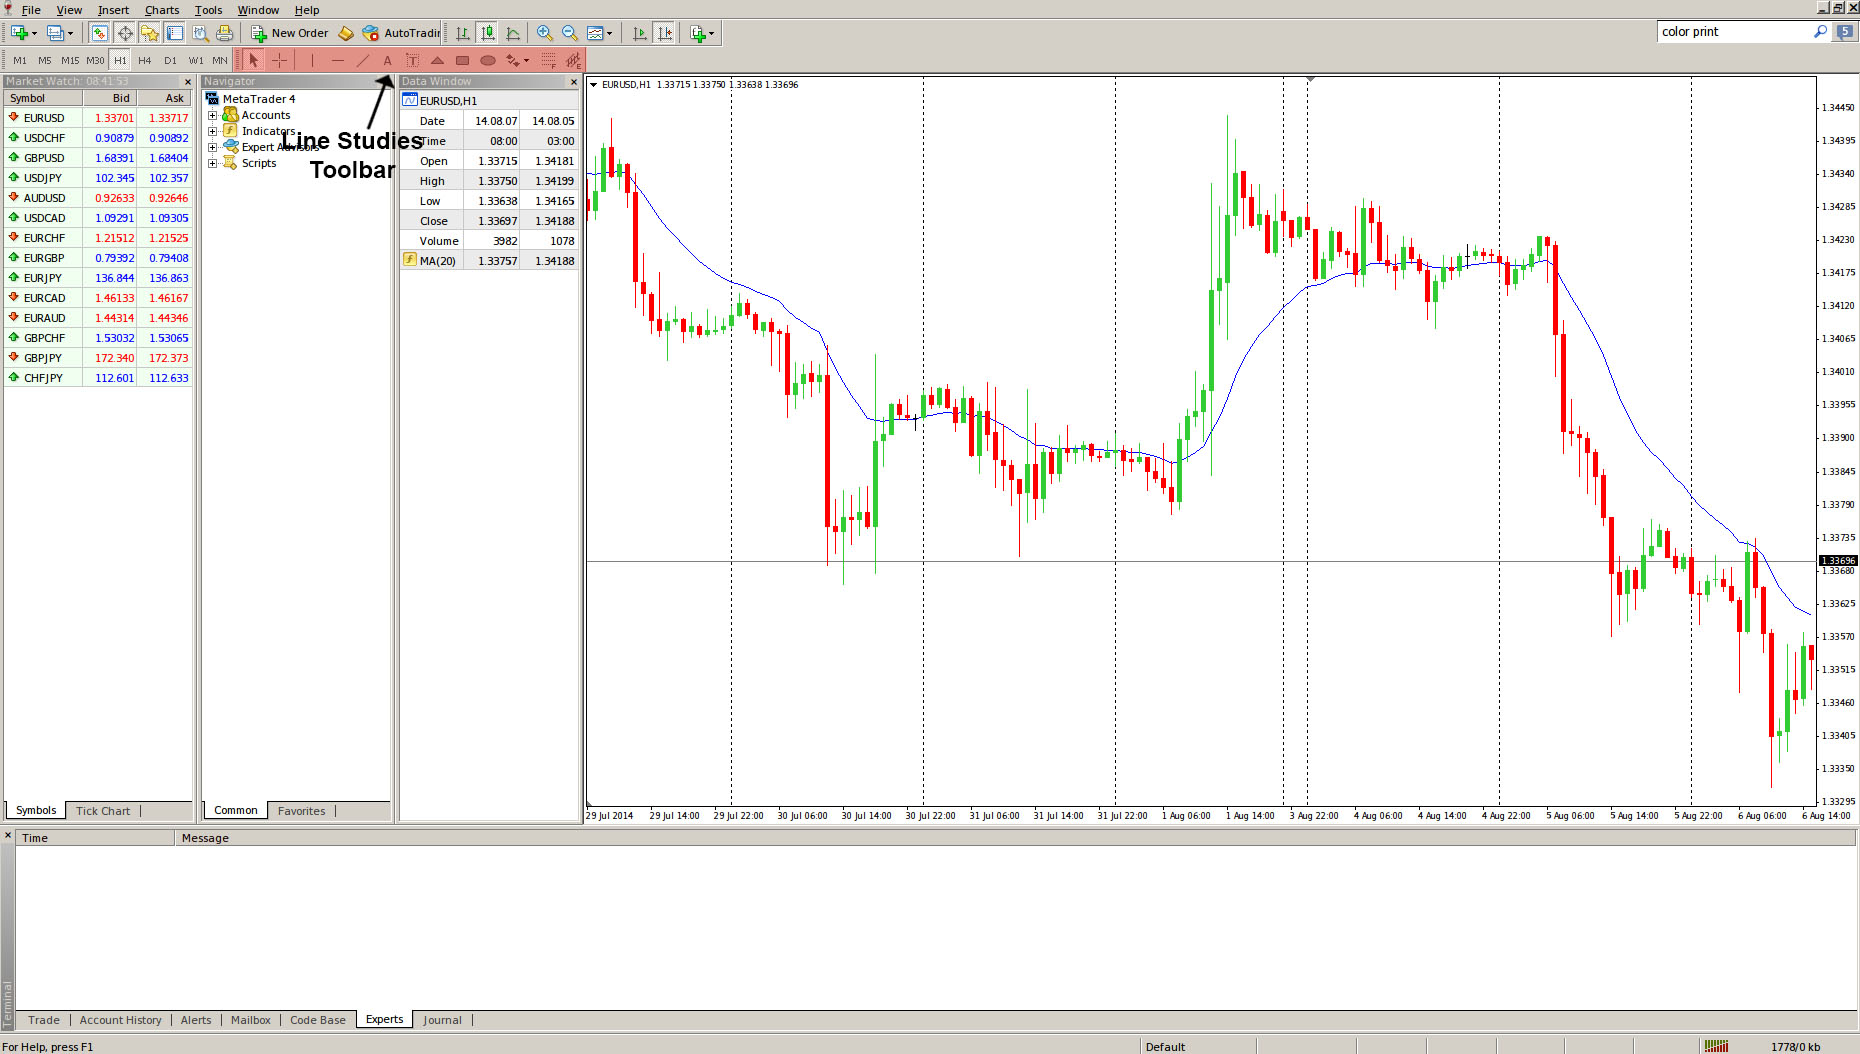
The MetaTrader 4 Line Studies toolbar contains icons used to quickly add line study elements and other graphical objects, such as text, shapes, signs etc. It can be found next to the Charts toolbar, but its position can be adjusted according to each users preferences. It can be further customized by adding or removing icons or changing their positions within the toolbar by right-clicking on the toolbar and selecting Customize. It is highlighted in red in the following screenshot.
All of line study elements and graphical objects listed in the Line Studies toolbar can also be accessed through the Insert menu button. Let us discuss some of them:
– Clicking on the ![]() icon will select the standard cursor mode, which allows you to select different objects on the chart.
icon will select the standard cursor mode, which allows you to select different objects on the chart.
– Pressing the ![]() button will engage “crosshair mode”. In this mode, the user can scroll to any given moment and two lines (one vertical and one horizontal) will connect the time and price scale at the cursors location. This allows the trader to easily see what the price was at a certain moment. Crosshair mode only works within the active chart window. Crosshair mode can alternatively be switched on by pressing the middle mouse button while scrolling over the chart.
button will engage “crosshair mode”. In this mode, the user can scroll to any given moment and two lines (one vertical and one horizontal) will connect the time and price scale at the cursors location. This allows the trader to easily see what the price was at a certain moment. Crosshair mode only works within the active chart window. Crosshair mode can alternatively be switched on by pressing the middle mouse button while scrolling over the chart.
– Clicking on the ![]() icon will allow you to plot a vertical line on the chart.
icon will allow you to plot a vertical line on the chart.
– Hitting the ![]() icon will allow you to place a horizontal line on the chart.
icon will allow you to place a horizontal line on the chart.
– Clicking on the ![]() allows you to draw a trend line on the chart.
allows you to draw a trend line on the chart.
– Hitting the ![]() will allow you to add a comment directly on the chart. As you scroll the chart, the comment will move together with it.
will allow you to add a comment directly on the chart. As you scroll the chart, the comment will move together with it.
– Clicking on the ![]() will insert a text label to a chosen spot on the chart. The difference with the previous Text option is that once the Text Label is inserted, it sticks to the window, not the chart, and will not move as the chart gets scrolled.
will insert a text label to a chosen spot on the chart. The difference with the previous Text option is that once the Text Label is inserted, it sticks to the window, not the chart, and will not move as the chart gets scrolled.
– Adding a triangle-shaped graphical option is done by clicking on the ![]() icon. It is used to illustrate the so-called “triangle” pattern, which, as technical analysts argue, is a breakout formation.
icon. It is used to illustrate the so-called “triangle” pattern, which, as technical analysts argue, is a breakout formation.
– Clicking ![]() allows you to plot a rectangle formation on the chart.
allows you to plot a rectangle formation on the chart.
– Hitting the ![]() icon inserts an ellipse-shaped formation, which traders use to select various areas on the chart.
icon inserts an ellipse-shaped formation, which traders use to select various areas on the chart.
– The Arrows menu, visualized by the ![]() icon, contains a list of graphical objects that can be placed anywhere on the chart. You can add Thumbs Up, Thumbs Down, Arrow Up, Arrow Down, Stop and Check signs, as well as Left and Right Price Labels.
icon, contains a list of graphical objects that can be placed anywhere on the chart. You can add Thumbs Up, Thumbs Down, Arrow Up, Arrow Down, Stop and Check signs, as well as Left and Right Price Labels.
– Clicking on ![]() allows you to draw Fibonacci Retracement levels in order to attempt to predict how much a price will retrace after a strong move.
allows you to draw Fibonacci Retracement levels in order to attempt to predict how much a price will retrace after a strong move.
– Hitting the ![]() icon will create an equidistant channel (two parallel lines) which can be used to encompass price action.
icon will create an equidistant channel (two parallel lines) which can be used to encompass price action.
Apart from the functions described above, a trader can customize his Line Studies toolbar to contain additional line study tools, in case they are used more frequently. By right-clicking on the toolbar and executing the Customize command, you can add Gann Line, Gann Fan, Gann Grid, Fibonacci Time Zones, Fibonacci Channel, Fibonacci Expansion, Fibonacci Arcs, Standard Deviation Channel and others.