MetaTrader 4 Charts Toolbar Overview
This lesson will cover the following
- Positioning
- Contents
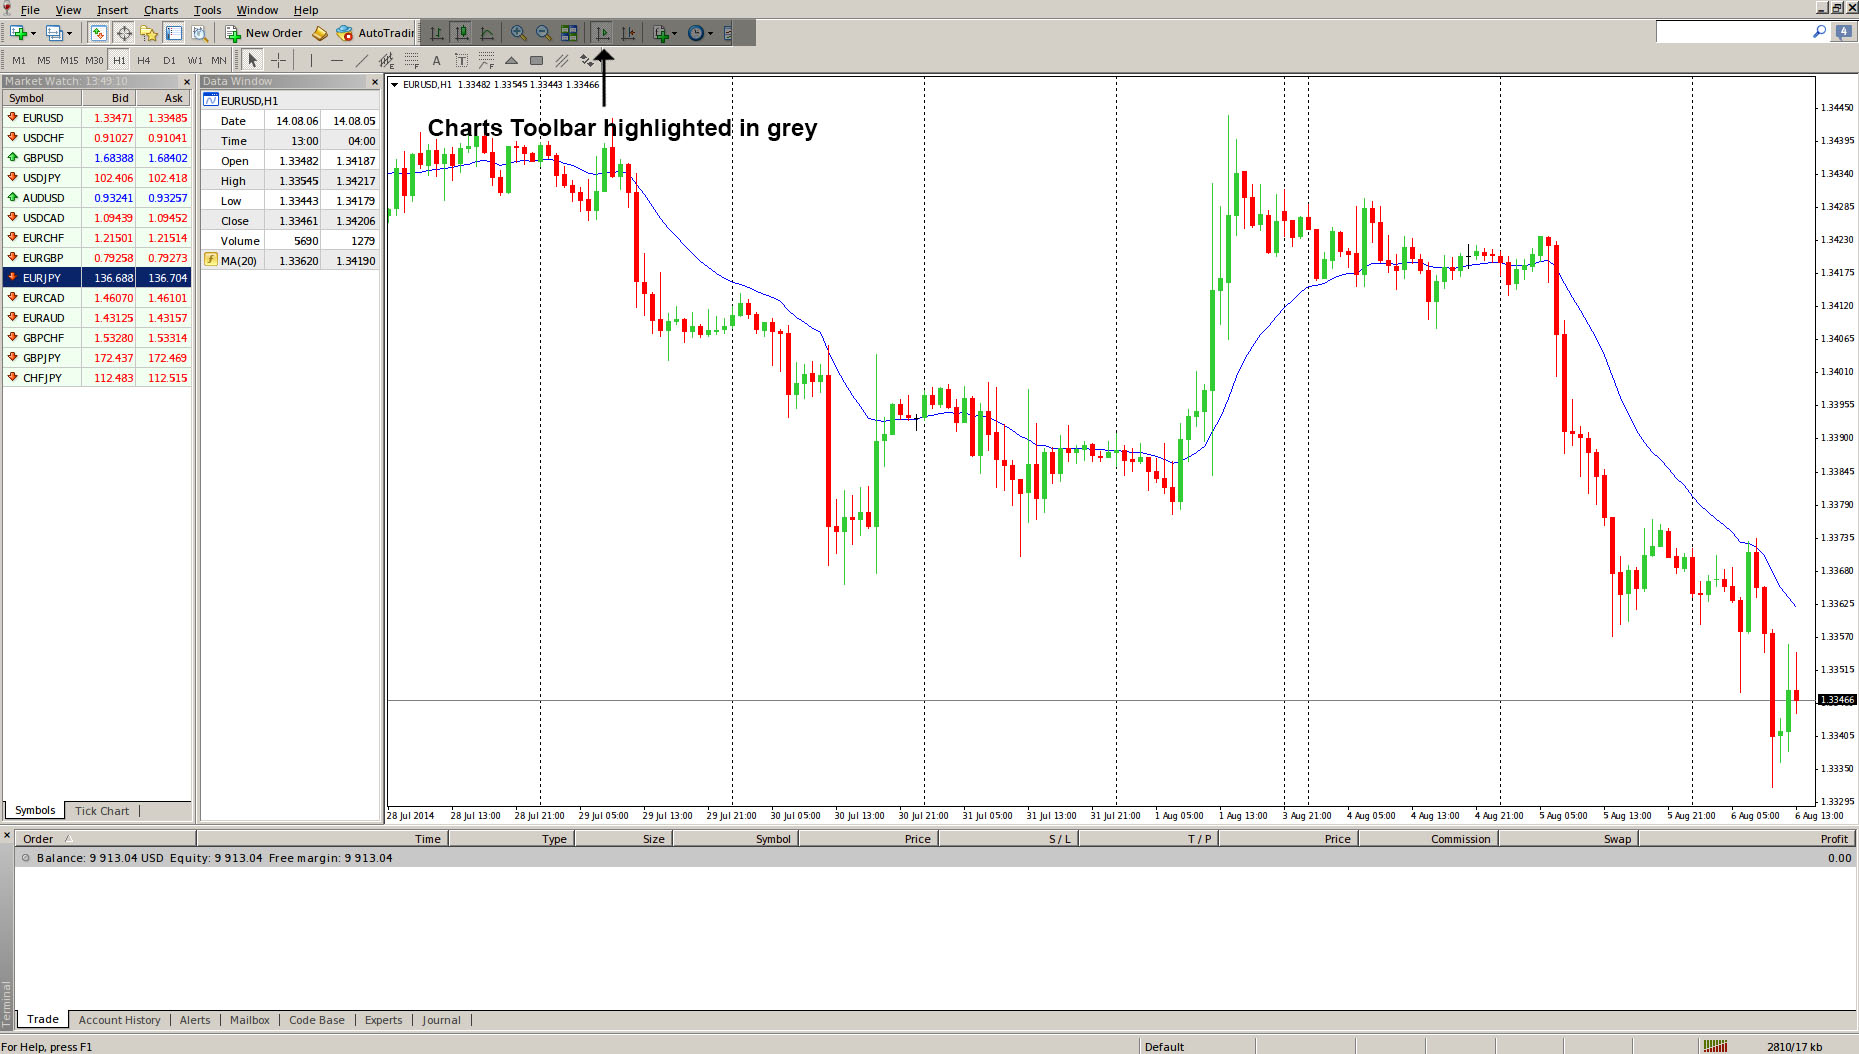
The MetaTrader 4 Charts toolbar contains commands used to manage the charts and the technical indicators traders use. By default, it is positioned to the right of the Standard toolbar, which we described earlier in our guide, just as the screenshot below shows:
The toolbar consists of 11 commands, which we will discuss below in an order from left to right:
– ![]() displays the chart as a sequence of bars. This can also be done by clicking the Charts >>> Bar Chart command or by hitting the Alt+1 hotkey combination.
displays the chart as a sequence of bars. This can also be done by clicking the Charts >>> Bar Chart command or by hitting the Alt+1 hotkey combination.
– ![]() shows the chart as a sequence of candlesticks. This can also be achieved by clicking Charts >>> Candlesticks or by pressing the Alt+2 key shortcut.
shows the chart as a sequence of candlesticks. This can also be achieved by clicking Charts >>> Candlesticks or by pressing the Alt+2 key shortcut.
– ![]() displays the chart as a broken line (transform into the line chart). The same action can be performed by the “Charts Line Chart” menu command or by pressing accelerating keys of Alt+3.
displays the chart as a broken line (transform into the line chart). The same action can be performed by the “Charts Line Chart” menu command or by pressing accelerating keys of Alt+3.
– ![]() zooms in the chart. The same action can be performed by hitting the Charts >>> Zoom In menu command, or by pressing the + keyboard key.
zooms in the chart. The same action can be performed by hitting the Charts >>> Zoom In menu command, or by pressing the + keyboard key.
– ![]() zooms out the chart. The same action can be performed by hitting the Charts >>> Zoom Out menu command, or by pressing the + key.
zooms out the chart. The same action can be performed by hitting the Charts >>> Zoom Out menu command, or by pressing the + key.
– ![]() is used to tile the open chart windows, arranging them within the space defined for charts.
is used to tile the open chart windows, arranging them within the space defined for charts.
– ![]() scrolls the chart automatically to the latest bars. If this option is enabled, the latest bars will always be displayed on the screen. Alternatively, you can click Charts >>> Auto Scroll.
scrolls the chart automatically to the latest bars. If this option is enabled, the latest bars will always be displayed on the screen. Alternatively, you can click Charts >>> Auto Scroll.
– ![]() moves the chart from the windows right border to the charts shift label. The chart shift label (a grey triangle in the upper part of the window) can be moved horizontally using the mouse within 10 to 50% of the window size. This command can also be executed by clicking Charts >>> Chart Shift.
moves the chart from the windows right border to the charts shift label. The chart shift label (a grey triangle in the upper part of the window) can be moved horizontally using the mouse within 10 to 50% of the window size. This command can also be executed by clicking Charts >>> Chart Shift.
– ![]() opens up the sub-menu in which all built-in technical indicators are grouped. From this screen you can insert indicators into the chart. Alternatively you can click on Insert >>> Indicators.
opens up the sub-menu in which all built-in technical indicators are grouped. From this screen you can insert indicators into the chart. Alternatively you can click on Insert >>> Indicators.
– ![]() opens the chart time frame sub-menu. When a period is selected, the corresponding changes will appear in the active chart. This can also be done by hitting the Charts >>> Periodicity menu command, by right-clicking on the chart and using the corresponding context menu command, or by using the corresponding buttons in the “Periodicity” toolbar.
opens the chart time frame sub-menu. When a period is selected, the corresponding changes will appear in the active chart. This can also be done by hitting the Charts >>> Periodicity menu command, by right-clicking on the chart and using the corresponding context menu command, or by using the corresponding buttons in the “Periodicity” toolbar.
– ![]() shows the templates sub-menu. Here you can choose any ready-to-use template, a new template can be stored or an existing one can be deleted. The same actions can be performed by going to Charts >>> Template or by right-clicking on the chart and using the corresponding chart context menu command.
shows the templates sub-menu. Here you can choose any ready-to-use template, a new template can be stored or an existing one can be deleted. The same actions can be performed by going to Charts >>> Template or by right-clicking on the chart and using the corresponding chart context menu command.