Sequence of moving averages (swing trading strategy)
This lesson will cover the following
- A quick overview
- Steps a trader needs to follow for this strategy
When we speak of a sequence of moving averages, we mean a situation in which, for example, during a bull trend the 10-day Simple Moving Average (SMA) is at a higher price than the 25-day SMA, which in turn is above the 50-day SMA. If we also plot a 100-day and a 200-day SMA, the 100-day moving average should be below the 50-day SMA, while the 200-day moving average should be below the 100-day SMA. During a bear trend the order of moving averages will be exactly the opposite – the 10-day SMA should be at the lowest price level and the 200-day SMA at the highest. This sequence of moving averages indicates that the market is trending, while each moving average can be used as a level of support. In addition to the sequence, a trader should pay attention to the ADX reading – whether it is above 20 and whether it is trending upwards.
Entry and exit points using this trading approach are hard to determine, but a trader will usually keep their position open as long as the above-mentioned sequence of moving averages remains intact and will close it as soon as the sequence is disrupted. A trader will generally attempt to detect and take advantage of this sequence when it first occurs, as it is not a common situation.
- Trade Forex
- Trade Crypto
- Trade Stocks
- Regulation: NFA
- Leverage: Day Margin
- Min Deposit: $100
What does a trader need to do?
As with any other trading approach, there are certain steps to be followed:
 The trader needs to identify a currency pair whose moving averages display this sequence.
 The trader needs to monitor the ADX – ensure it is trending upwards and that its reading is above 20.
 The trader should enter a long position five candles after the sequence of moving averages first appears, provided it is still present.
 Long traders should place their protective stop at the low of the day on which the initial crossover occurs, while short traders should set it at that day’s high.
 The trader should close the position if the sequence disappears.
Example
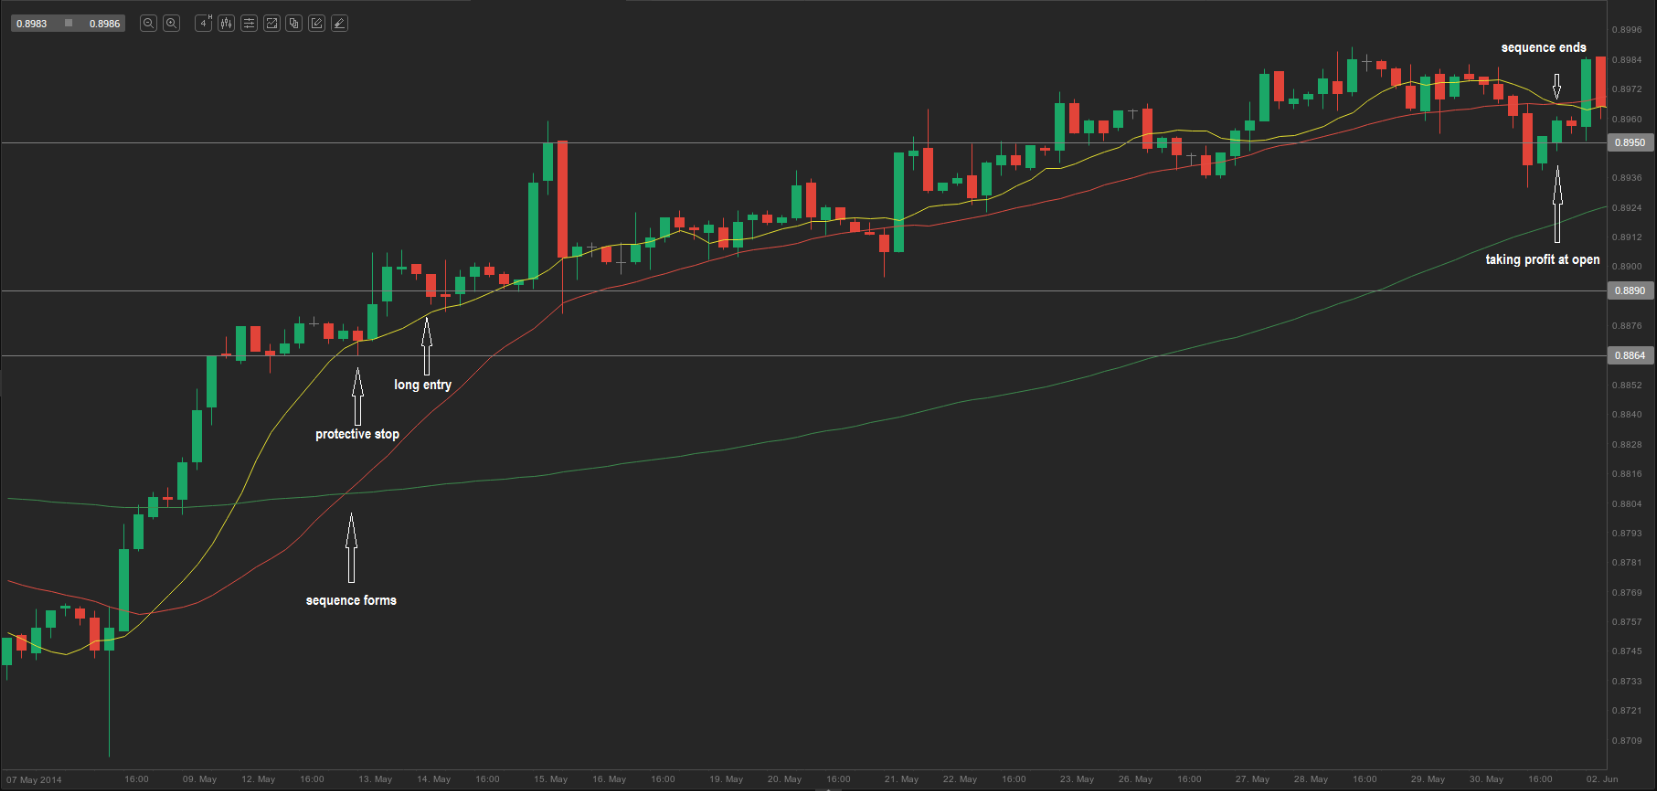
 Let us examine the 4-hour chart of USD/CHF. On 13 May the 10-day SMA (yellow), the 25-day SMA (red) and the 100-day SMA (green) form a sequence. Our long entry is five candles after the sequence forms, at a price of 0.8890. Our protective stop is placed at the low of 13 May, or 0.8864. As the pair continues its bull trend, we exit the position when the sequence is no longer present (when the 10-day SMA crosses below the 25-day SMA, which occurs on 2 June). The pair opens at 0.8950 on that day, giving us a profit of 60 pips while risking 26 pips on this trade.