Positioning at breakouts from inside days
This lesson will cover the following
- Advantages of the inside day breakout strategy
- Inside-inside pattern
- Steps to follow
In this article, we discuss one of the most popular trading strategies based on changes in volatility – the inside-day breakout strategy. It is widely used because of its high reliability, relative accuracy and simplicity, as it requires no indicators – just market observation. It is based on the assumption that the longer the market remains in a trading range, especially if that range is narrowing, the closer it is to a breakout.
Inside-inside pattern

In the article ‘Other Types of Signal Bars and Patterns’ from our Price Action Trading guide, we discussed the so-called inside-inside pattern. It is a breakout setup that can turn into a flag – a continuation setup – or become a reversal formation. The strategy we are about to examine applies directly to the inside-inside pattern, but viewed on the daily time frame. A variation of the inside-inside pattern, the inside-inside-inside pattern, is an even more reliable breakout setup.
- Trade Forex
- Trade Crypto
- Trade Stocks
- Regulation: NFA
- Leverage: Day Margin
- Min Deposit: $100
 An inside day is a day whose trading range is completely encompassed by the previous one, i.e. it has a lower high and a higher low than the previous day. For our trading strategy to work, we need at least two consecutive inside days – an inside-inside pattern. Thereafter, the greater the number of inside days, the more reliable the breakout pattern becomes. The aim is to predict the forthcoming move without being caught by a false breakout (a fake-out).
This strategy works best on daily charts, although some traders prefer hourly time frames, particularly before the London and US market opens, when volatility tends to spike. It can be applied to any currency pair, but fake-outs are less frequent with tighter-range crosses such as USD/CAD, EUR/GBP, EUR/CAD, etc.
Higher probability
 To improve the likelihood of correctly predicting the breakout direction, traders can combine this strategy with technical analysis patterns or indicators. Because the extremes of inside-inside patterns form in such a way that they resemble a triangle or wedge, the price action within the pattern will display similar behaviour and is likely to resolve in the same direction. See the screenshot below.
As shown in the example above, the highlighted inside-inside-inside pattern took the form of a symmetrical triangle. Although the high of the last candle extends slightly beyond the previous ones, this is negligible (as we have said, what looks like an almost perfect pattern will trade like a perfect pattern). Moreover, the three inside bars were large doji bars, evidence of the bulls’ attempt to reverse the initial large bear trend bar. When they failed to do so after three attempts and the price fell below the first doji’s low, the bulls closed their positions and the bears drove the market lower. Three factors therefore indicated the impending breakout: the inside-inside-inside pattern (more definite than an inside-inside pattern), its symmetrical-triangle shape, and its composition of doji bars.
In general, if the market forms inside days near the top of a trading range in the shape of an ascending triangle, an upward breakout is more probable, and vice versa. Similarly, if price action consolidates in a range immediately above a significant support level – such as a moving average, round number or Fibonacci level – a downward breakout is less likely and, even if it occurs, has a greater chance of failing.
Strategy explanation
 The strategy comprises several steps. Assume you intend to open a long position. The first step is to identify a currency pair whose average daily range is contained within the previous day’s range and which, itself, is an inside day. Once such a scenario develops, place a buy order above the previous inside day’s high – for example, 10 pips above it.
As noted in the article ‘Other Types of Signal Bars and Patterns’, inside-inside patterns are traded by entering on the breakout and placing protective stops beyond the opposite side of the pattern. In our case, you can guard against a failed breakout by placing a stop-and-reverse order 10 pips below the low of the previous inside day. If the market reverses and that order is triggered, set a protective stop 10 pips above the high of the previous inside day. In both scenarios, aim for a profit equal to twice the amount risked. Once that target is reached, you can either exit entirely or scale out and leave part of the position open. If you choose to remain in the market, trail your stop to shield yourself from an unexpected reversal. Let’s look at the following example.
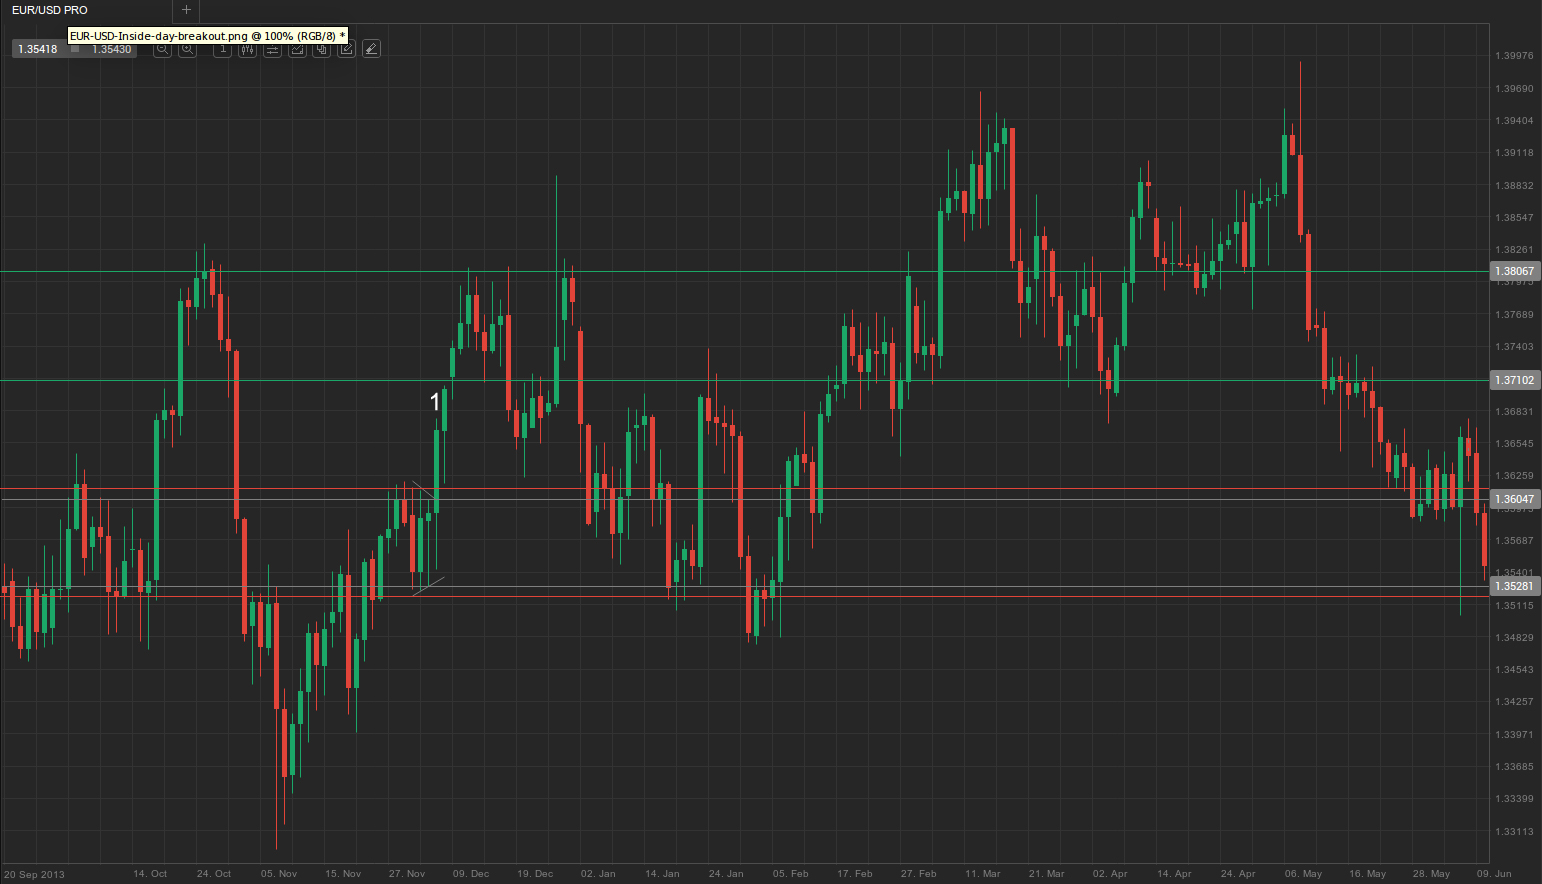
The chart above is a daily EUR/USD chart. Let’s assume the date is the start of 5 December, represented by bar 1. Observing the inside-inside pattern formed by the previous three bars, you anticipate a breakout. According to the inside-day breakout strategy, place a long entry order 10 pips above the high of the previous inside day or a short entry order 10 pips below its low. The high and low are indicated by the horizontal grey lines at EUR/USD 1.3604 and 1.3528, respectively, while the 10-pip buffers are shown by the two red lines at 1.3614 and 1.3518.
In this scenario, the market accelerated upwards and broke out of the range at bar 1, triggering the long entry at EUR/USD 1.3614. Once the order is filled, place a stop-and-reverse order 10 pips below the low of the previous inside day (in this example, the lower red line at EUR/USD 1.3518). Having determined your entry point and stop-loss level, you now need to set your profit target.
Under the strategy, the profit target is twice the amount risked. The risk equals the entry price minus the stop-loss level – in our example, 1.3614 − 1.3518, or 96 pips. We entered at 1.3614, so twice the risk is calculated as 1.3614 + 2 × 0.0096 = 1.3806, indicated by the upper green line. More conservative traders might prefer to scale out, taking partial profits at 100% of the risk (1.3614 + 0.0096 = 1.3710, shown by the lower green line) and then riding the remainder of the position higher while protecting it with a trailing stop. In this case, the market completed the full measured move but reversed only a few pips afterwards.