Fading false breakouts strategy
This lesson will cover the following
- A quick overview
- Steps a trader needs to follow for this strategy
At some point, a trader may encounter a potential breakout scenario and position themselves accordingly, only to witness a failed trade because the market has returned to its trading range. Even if the price manages to breach a key level, it is not certain that the move will continue. Although breakout levels are of utmost significance, there is no rule indicating how much momentum is needed to push the price beyond these levels and form a sustainable trend.
 Trading breakouts from key levels involves a high level of risk, and it is therefore more common for traders to witness a failed breakout than a successful one. Also, because the market usually tests a key resistance or support level more than once before a breakout occurs, many traders have developed counter-trend approaches that look for opportunities to fade breakouts. However, fading a breakout can lead to huge losses because, once a genuine breakout occurs, a strong and lasting trend often follows.
- Trade Forex
- Trade Crypto
- Trade Stocks
- Regulation: NFA
- Leverage: Day Margin
- Min Deposit: $100
Fading requires a trader to study consolidation patterns to identify an entry with a higher probability of becoming a failed breakout. In practice, traders usually rely on daily charts to detect trading ranges and on 1-hour or 4-hour charts to fine-tune their entries.
What does a trader need to do?
 There are certain steps to follow in order to implement the ‘fading strategy’.
When going long:
 a trader looks for a currency pair with a 14-period Average Directional Index (ADX) below 35, or with an ADX currently trending lower (which implies further weakness);
 the trader waits for the price to move at least 15 pips below the previous day’s low;
 the trader places a buy order 15 pips above the previous day’s high;
 once the order is filled, they place a protective stop 30 pips below the entry price;
 the trader takes profit as soon as the market moves up by at least 60 pips (twice the risk).
When going short:
a trader looks for a currency pair with a 14-period Average Directional Index (ADX) below 35, or with an ADX currently trending lower (which implies further weakness);
the trader waits for the price to move at least 15 pips above the previous day’s high;
they place a sell order 15 pips below the previous day’s low;
once the order is filled, they place a protective stop 30 pips above the entry price;
the trader takes profit as soon as the market moves down by at least 60 pips.
This trading approach should be implemented only when no crucial macro-economic reports are due, as such releases often trigger large moves in either direction. Consolidation is usually observed during the hour immediately preceding the release of key economic data such as the unemployment rate and the change in non-farm payrolls in the United States. Such consolidation results from indecision among market participants: some will have already positioned themselves, while others prefer to act after the data are published. It should be noted that any breakout following such key releases is likely to be genuine, so fading it is not recommended. Overall, this approach is best used with currency pairs characterised by lower volatility!
Example
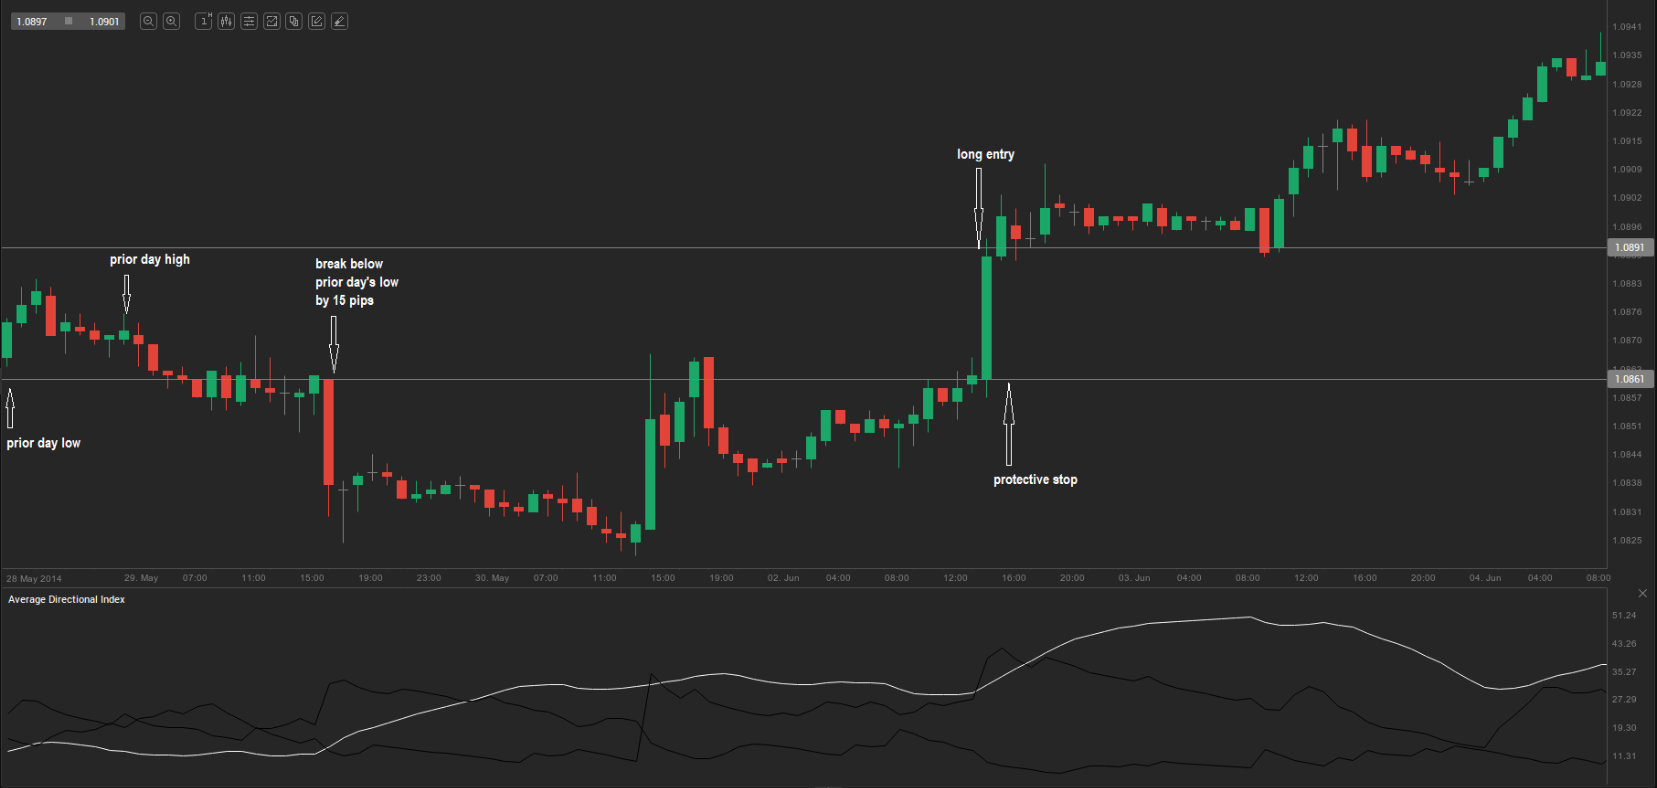
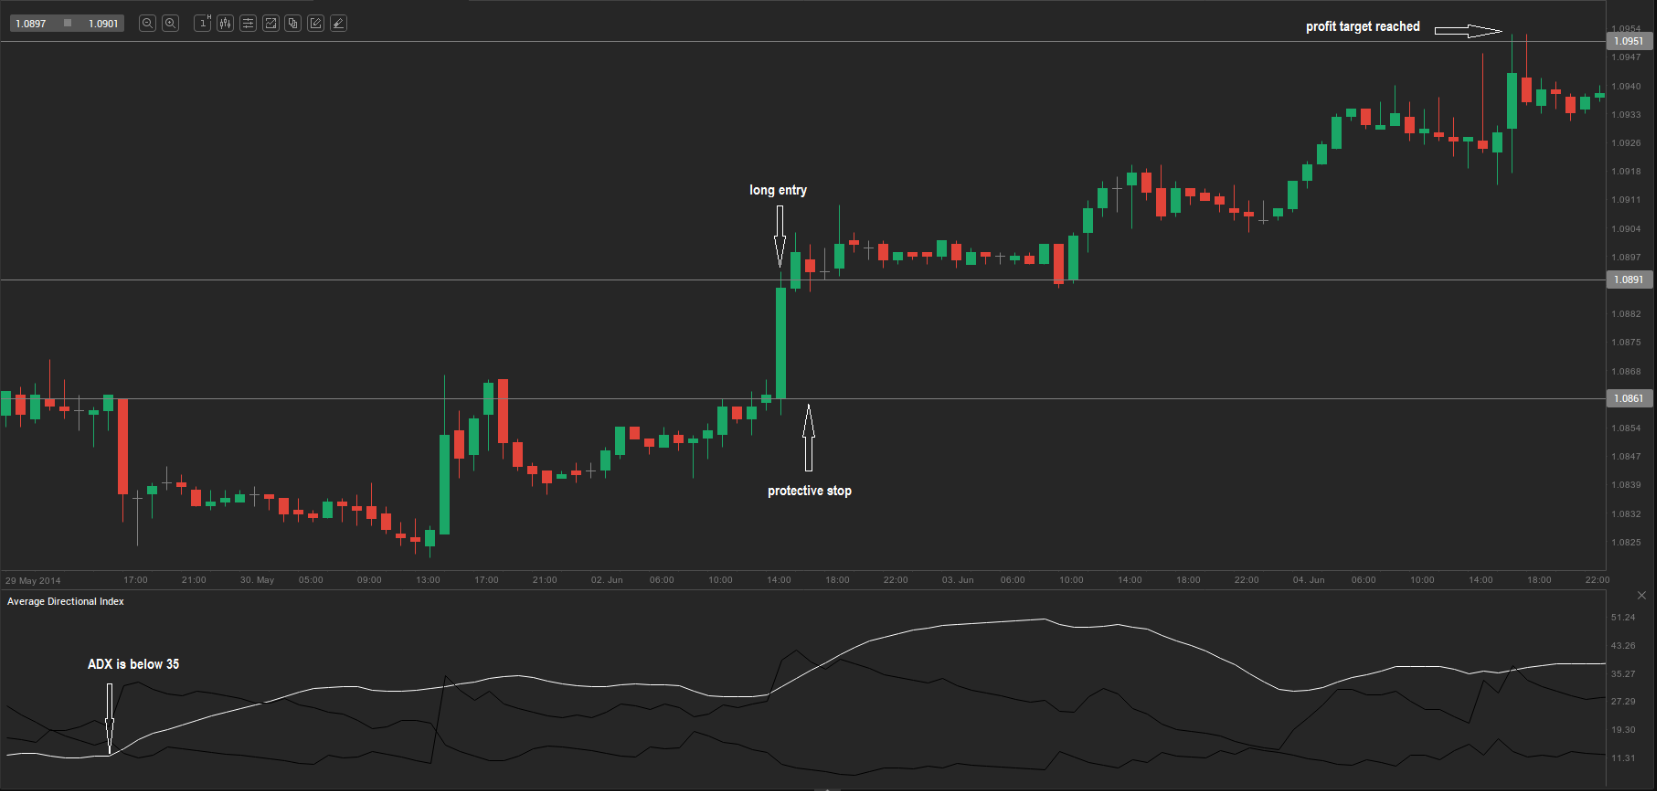
 Let us examine the 1-hour chart of USD/CAD. The 14-period ADX has dropped below 35, so at this point we can begin looking for a breach 15 pips below the previous day’s low (1.0864). Once this break occurs, we then look for a move 15 pips above the previous day’s high (1.0876). When that happens, we enter a long position at 1.0891. The protective stop is set 30 pips below the entry, at 1.0861, and the profit target is 60 pips above the entry, at 1.0951. The order is later closed for a 60-pip profit, with only 30 pips of risk.