Positioning based on analysing different time frames
This lesson will cover the following
- Multiple time-frame analysis
- Commonly used strategies
- Steps to follow
We’ve said multiple times in our guides that the most profitable way to trade is to ride the trend and not go against the market. Although trading ranges occasionally present very tempting and, in some cases, reliable entry points, they are much harder to profit from consistently and thus should be avoided by novice traders. Contrarian trading can also yield great results, but it involves an immense amount of risk and is practised almost exclusively by trading gurus for a reason.
Thus, trend trading is your best chance to become a consistently profitable trader. Many market players, however, make the mistake of focusing on a single small time frame and letting the broader picture slip from sight. This, of course, is not in their favour because trend trading is best practised when you have a complete idea of market developments. An overview of the market can provide useful information, such as overall market sentiment and potential future movements in the medium term.
- Trade Forex
- Trade Crypto
- Trade Stocks
- Regulation: NFA
- Leverage: Day Margin
- Min Deposit: $100
Commonly used
 One of the most common multiple-time-frame strategies that day traders use is to grasp the general picture on a daily time frame and then drop to a lower time frame (5-60 minutes) to spot the best entry points – typically the ends of pullbacks. Many novice traders practise the so-called range trading because the idea of buying low and selling high is seen as the most lucrative and easy-to-explain strategy.
However, range trading carries a much greater risk compared with trend following, and here is the basic explanation. During strong trends, say a bull trend, the market spends far more time advancing and marking higher highs and higher lows than forming lower highs or lower lows. If you buy high, even if the market retraces some of its previous gains, the trend will likely not be over and the price will eventually rise again (trend reversals are much less common than pullbacks and trend continuations). If you want to learn more about trend trading and trend reversals, you can find a lot of useful information in Trading Pedia’s Price Action Academy, starting with the article “Trend Trading Guidelines“.
Trading ranges are trickier
 Conversely, during trading ranges the market moves sideways as bulls and bears reach a state of equilibrium, making it hard to predict the direction of the breakout. If a trader then enters a position that turns out to be wrong, it is uncertain when, or even if, the market will reverse in his favour.
For example, if the price rises and reaches the resistance zone, many traders would go short, hoping the market will rebound and edge lower. If it instead breaks out to the upside and continues higher, the position becomes a loser and the trader will be stopped out at his protective stop level.
Because every trend and trading range is part of a larger trend or trading range, multiple-time-frame analysis is very helpful when you want to determine exactly how to act on your preferred time frame by grasping the broader picture on a higher time frame. Often, it will assist you in determining the direction in which the price will break out of the trading range on the lower time frame. Thus, having an overview of the general picture helps traders avoid many bad trades, especially those taken against the trend on a higher time frame.
In the screenshot below you can see a weekly chart of USD/CAD.
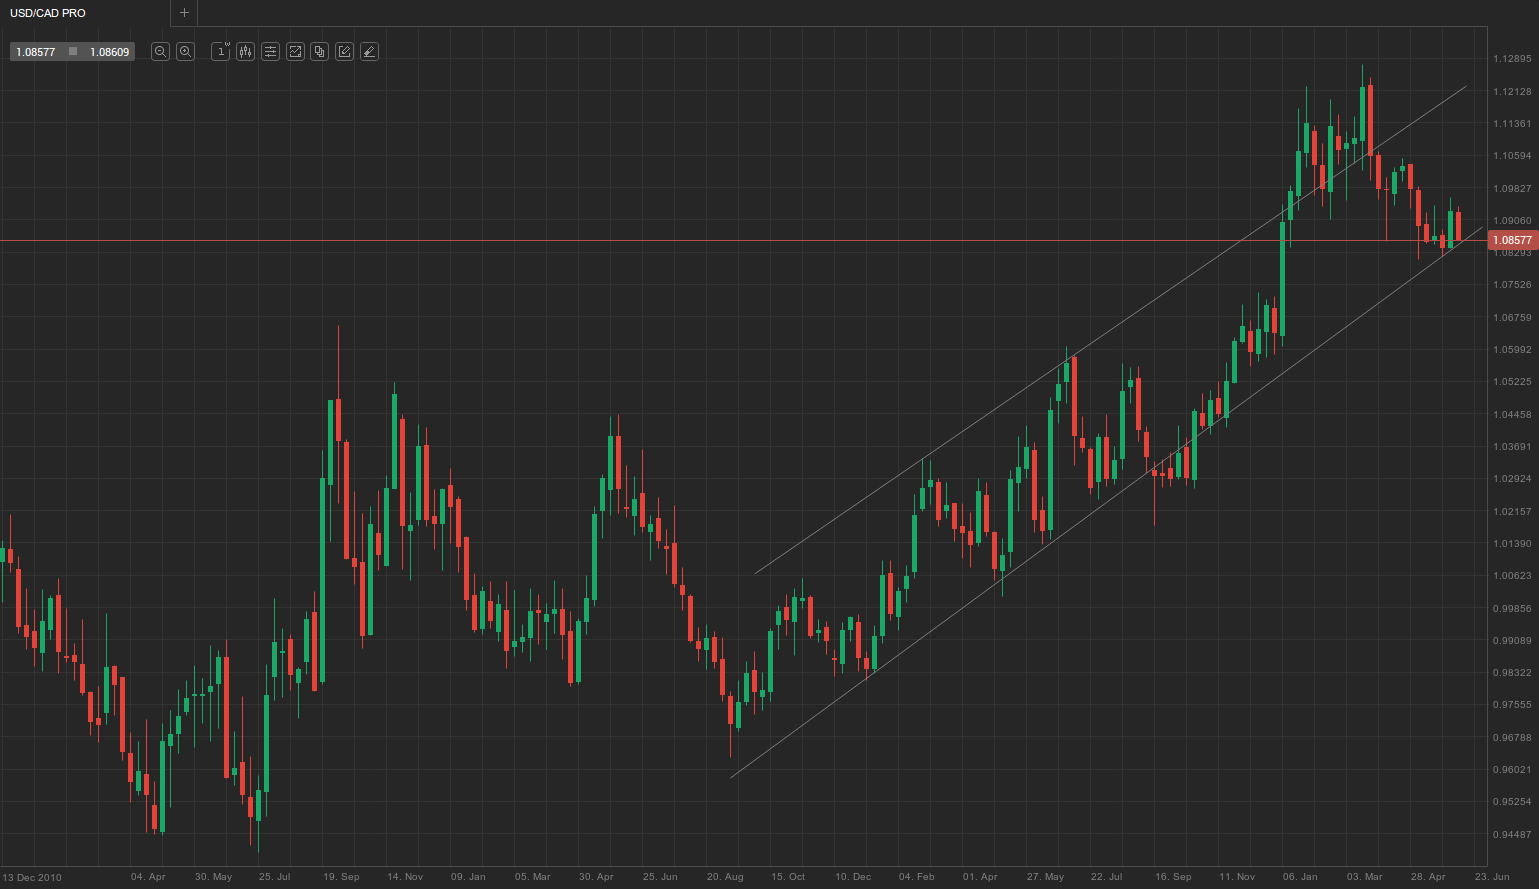
As you can see, the US dollar has been in a strong bullish trend against the Canadian dollar since the third quarter of 2012, reaching its highest level in five years in March 2014. This implies that any long-term positions should take the larger bull trend into account. The trader should keep the overall market direction in mind even for short-term positions that will be closed within a day or two. Take a look at the hourly chart of the USD/CAD cross.
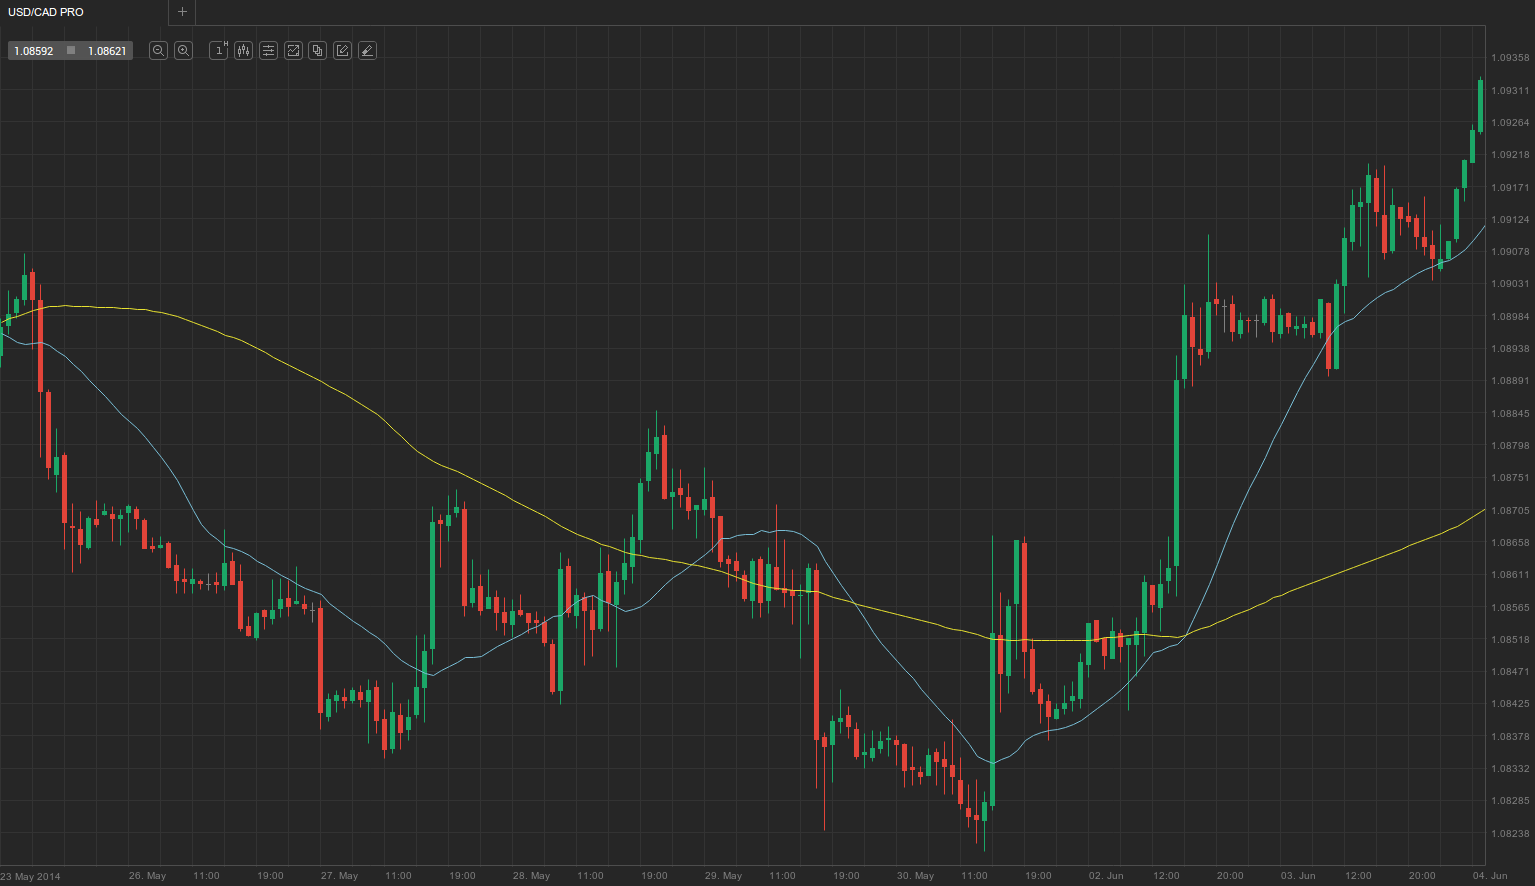
You can see that although the market turns bearish and sideways on the smaller time frame, it eventually reverses into a stronger bull trend, offsetting the previous losses. Although this is not always bound to be the case, having a good idea of the broader picture will surely improve your judgement. By using the smaller time frame in conjunction with different tools – in our case two simple moving averages, a 20-period and an 89-period (blue and yellow respectively) – you can more accurately pinpoint entry points, especially long entries backed by the general trend. You can bet on SMA penetrations as well as SMA crossovers. In our case, the market gapped above the 20-period SMA and was well above the 89-period one, thus favouring a long position additionally supported by the larger trend. Fibonacci retracement levels, SMA envelopes, Bollinger Bands, etc. can also be employed.
Multiple-time-frame analysis can be used on lower time frames as well. In the screenshot below you can see a 30-minute chart of the GBP/USD pair.
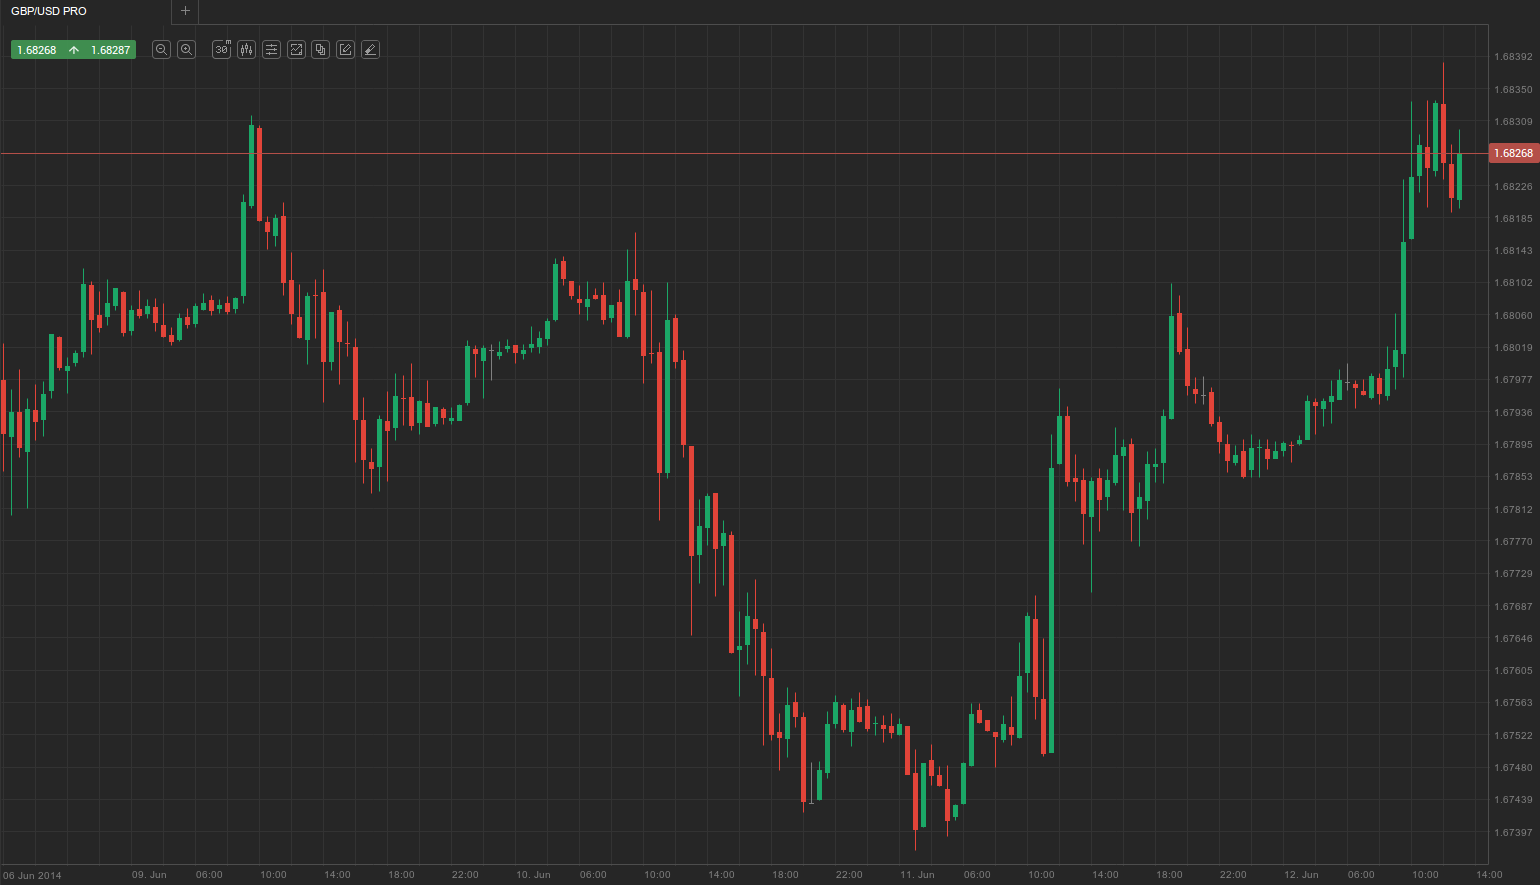
First, we start with the 30-minute chart and see that the market has entered a small trading range within a bull trend. To get a better idea of the overall market development, you can switch to a higher time frame and check whether the smaller trend coincides with the larger one.
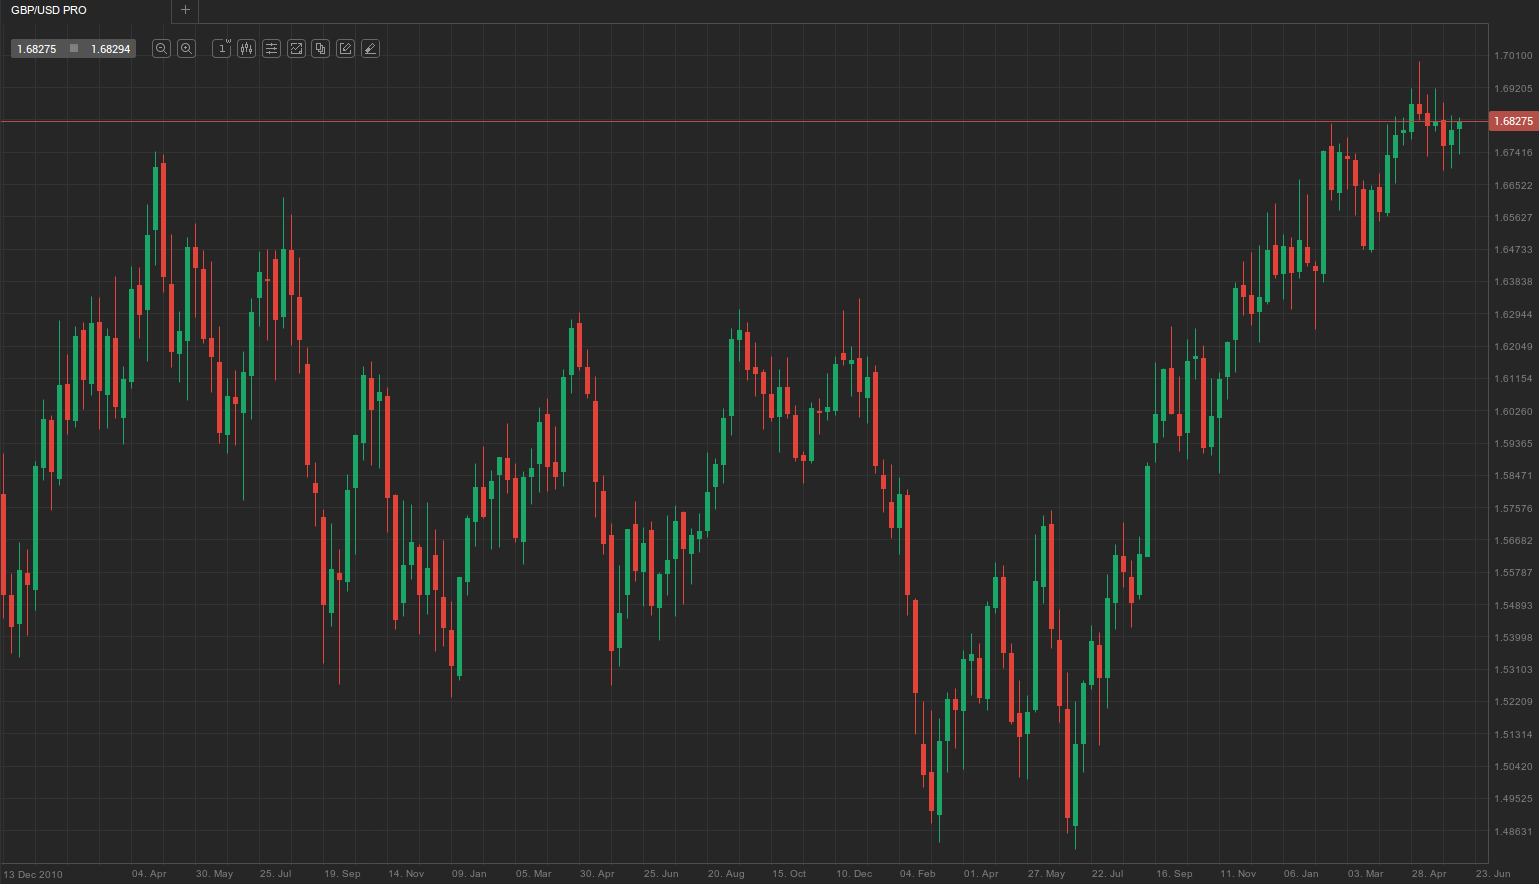
The weekly time frame shows that the market is in a strong bull trend, which confirms our 30-minute time-frame analysis. You can then drop down to an even smaller time frame – 10 or 15 minutes – to achieve the best positioning.