Types of trading ranges
This lesson will cover the following
- Tight trading ranges
- Variations of tight ranges
Tight trading ranges

We shall begin with the so-called tight trading ranges. These represent any sideways price movement comprising at least two bars, with considerable overlap between them. Buying and selling activity is balanced, while market participants await the eventual breakout from the range and the subsequent price development. Sometimes trading ranges may have a slight upward or downward slope (as mentioned, channels and micro-channels can be considered as such), so they should be traded in the same way as traditional ranges. As bulls and bears are in balance within the tight trading range, the most appropriate trading decision would be to wait for failed breakouts or pullbacks after breakouts.
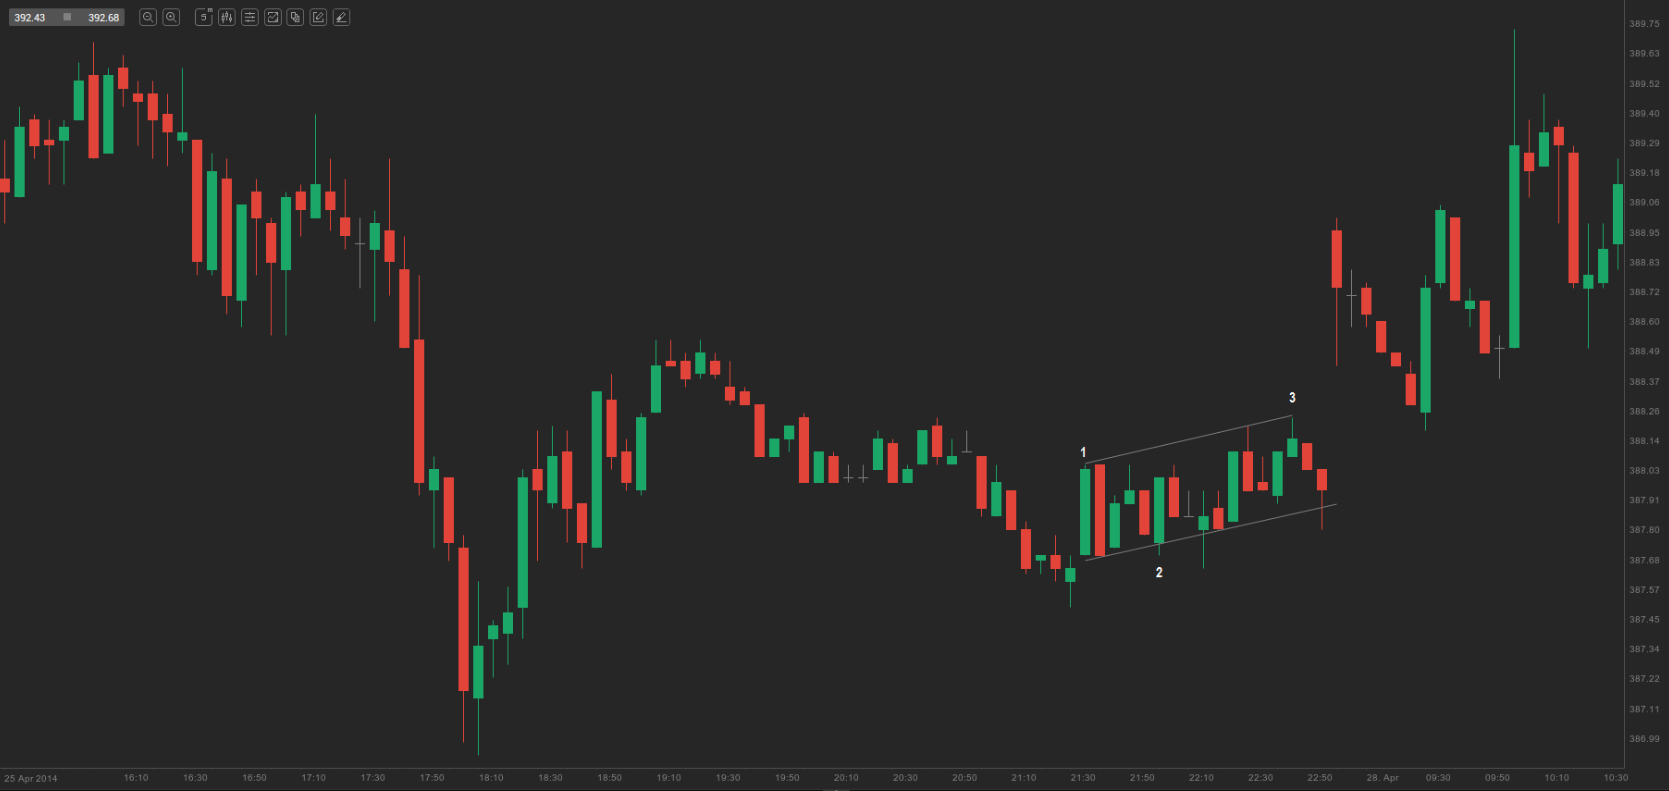
On the chart above we can see that, at some point, the market was in a tight trading range with an upward slope. The range followed two bearish moves, one sharp and one flatter; thus, it was reasonable to expect that the range might be prolonged and probably lead to two moves to the upside. Actually, the move to bar 3 was the first leg up.
Trading these formations can be quite tricky, so beginners should trade them only rarely or simply stand aside and wait for more clarity.
![]() Tight trading ranges, in general, are trend-continuation patterns. However, there are cases – for example, when a climax occurs, such as a trend channel line overshoot followed by a reversal – in which the price can breach either the upper or the lower area of the range. This is possible because the climax has probably induced momentum in the opposite direction. A trader will likely not be aware whether this new momentum will continue and produce a breakout, or whether the momentum generated by the original trend will reassert itself.
Tight trading ranges, in general, are trend-continuation patterns. However, there are cases – for example, when a climax occurs, such as a trend channel line overshoot followed by a reversal – in which the price can breach either the upper or the lower area of the range. This is possible because the climax has probably induced momentum in the opposite direction. A trader will likely not be aware whether this new momentum will continue and produce a breakout, or whether the momentum generated by the original trend will reassert itself.
- Trade Forex
- Trade Crypto
- Trade Stocks
- Regulation: NFA
- Leverage: Day Margin
- Min Deposit: $100
Variations of tight ranges
 Other variations of tight trading ranges are horizontal flags and ‘barb wire’ ranges. They usually produce breakouts in the direction of the original trend. At times these formations can encompass more than 20 bars with short wicks, at which point they can no longer be used as a basis for forecasts. In such cases, the best decision for a trader is to wait for the breakout. Very often, breakouts fail within 1-2 bars, so there is a good chance to profit by entering on the failure rather than on the breakout itself.
![]() There are cases when a failure may turn out to be a pullback following the breakout. In that scenario, a trader would place a stop order in the direction of the breakout as soon as the bar following the pullback exceeds the extreme price of the pullback bar. If the breakout is to the upside, the trader will likely place a stop order to buy at one tick above the high of the pullback bar. If the pullback bar breaches the opposite side of the range, the trader will likely place a stop order to sell at one tick below the tight trading range.
There are cases when a failure may turn out to be a pullback following the breakout. In that scenario, a trader would place a stop order in the direction of the breakout as soon as the bar following the pullback exceeds the extreme price of the pullback bar. If the breakout is to the upside, the trader will likely place a stop order to buy at one tick above the high of the pullback bar. If the pullback bar breaches the opposite side of the range, the trader will likely place a stop order to sell at one tick below the tight trading range.
The move following the breakout is rarely strong, so the market often enters a flat trend for the remainder of the trading day (another tight trading range). These formations may contain a number of setups within them (for instance, micro-trendline breaches), and trading these can be more profitable than trading the breakouts from the range. A trader will typically enter only if the signal bar is small and located close to either edge of the trading range (for example, going short below the low of a small bar near the top of the range).
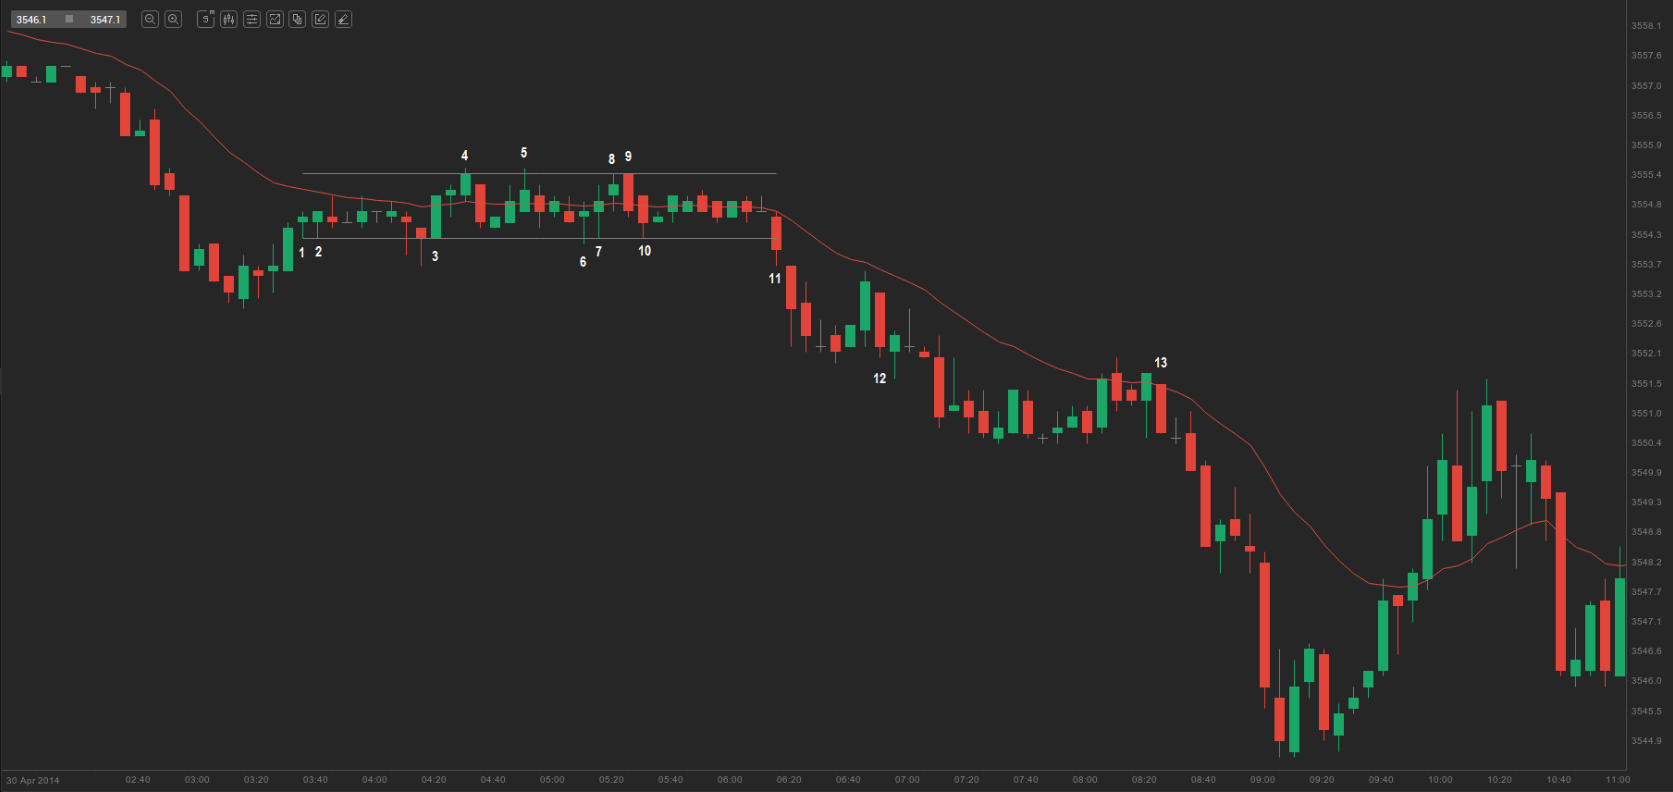
On the 5-minute chart of NDAQ 100 above, another tight trading range is visualised. Bars 7 and 10 failed to break out from the lower area of the range. The move preceding the range was bearish, and as most bars did not manage to move above and away from the exponential moving average, it was logical to expect that the breakout from the range would be to the downside. Bar 11 was a clear M2S setup (we shall discuss these in one of our next articles) and represented the third, successful breakout from the range. Another appropriate short entry would have been 1-2 ticks below the lows of bars 7 and 10, as well as 1-2 ticks below the daily low. A high-probability short entry would have been on the first pullback after the breakout at bar 12. Bar 13 was another good M2S setup.