Trending trading ranges in stock trading
This lesson will cover the following
- Trending trading range days
- Opening trading ranges
- Successive trending ranges
- What should traders aim to do
Previously, we covered trending trading ranges in general, and now it is time to discuss this type of market behaviour specifically in stock trading, owing to the unique characteristics associated with the stock market’s trading hours.
Generally, trending trading range days begin with an opening range which is 30-50% of the recent days’ average range. Usually, the day’s first trading range breaks out an hour or two after the open, and the market then enters another, higher or lower, trading range, as shown in the screenshot below.
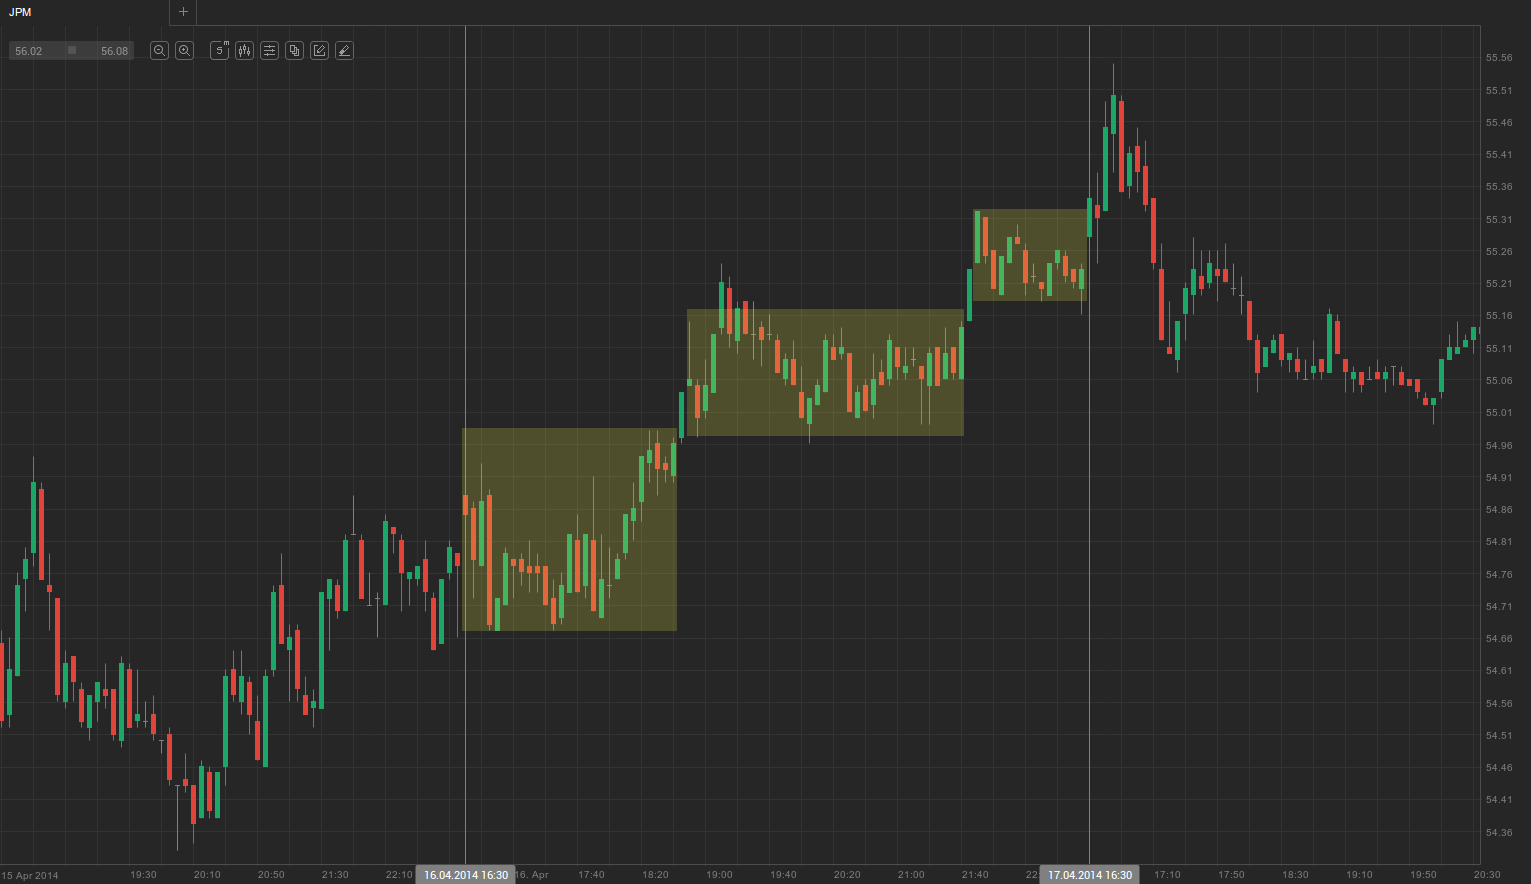
Usually, as the second range begins to form, there is a pullback testing the previous range. Often it manages to break back into the previous range, but if it does not, the trend is considered stronger. However, the stronger and more sustainable the breakout is, the greater the chance that the day will become a spike plus channel trend day, instead of a trending trading range day. If the pullback, however, manages to extend beyond the lower trading range, then the day turns into a reversal day. Most reversal days begin as a trending trading range day.
Since trend pullbacks are basically trading ranges, trending range days – or at least parts of them – can be observed during each trend day, making them a very common occurrence. These trend days are made up of several trading ranges, which transition into each other via breakouts.
Initial trading range
 The opening trading range tends to last between one and three hours and, as noted above, is usually 30-50% of the recent days’ average range. It reflects the market’s unwillingness to make any steep moves and shows a lack of urgency. This sentiment suggests the day is unlikely to become a strong trend day. Moreover, the initial trading range has the so-called ‘Vacuum effect‘, which pulls the price back when it breaks out of the trading range, preventing it from moving too far away and thus forming a second range close to the first one.
There is a distinct difference between the spike of a spike plus channel trend day and the spike (breakout) that acts as a transition between two trending ranges.
- Trade Forex
- Trade Crypto
- Trade Stocks
- Regulation: NFA
- Leverage: Day Margin
- Min Deposit: $100
The spike of a spike plus channel trend day usually occurs at the beginning of the trading day. It consists of several large trend bars with small shadows and little overlap. It can also be a large opening gap. Regardless of whether it is a succession of strong trend bars or a large gap, it usually breaks above or below the previous day’s high or low, whereas the spike in a trending trading range day usually remains within the previous day’s range. Moreover, it is composed of fewer bars, which commonly have smaller bodies and larger shadows, and the bars overlap each other.
If the pullback from the breakout goes sideways for several bars or enters a weak channel with overlapping bars, it is usually a trending trading range day. Conversely, if the pullback is a single large bar and the breakout from the pullback is another spike, it will likely be a channel trend day. Generally, if the pullback from the breakout is strong enough to make traders hesitate to enter with the trend, a trading range is more likely to occur than a trend channel.
Late breakout
 When the day begins with a trading range that is as much as half of the recent days’ range and the breakout from that range begins late in the day, you should not expect the breakout to form a strong trend. Instead, it more often pulls back and the market forms a higher or lower trading range instead of entering a strong trend. See the screenshot below.
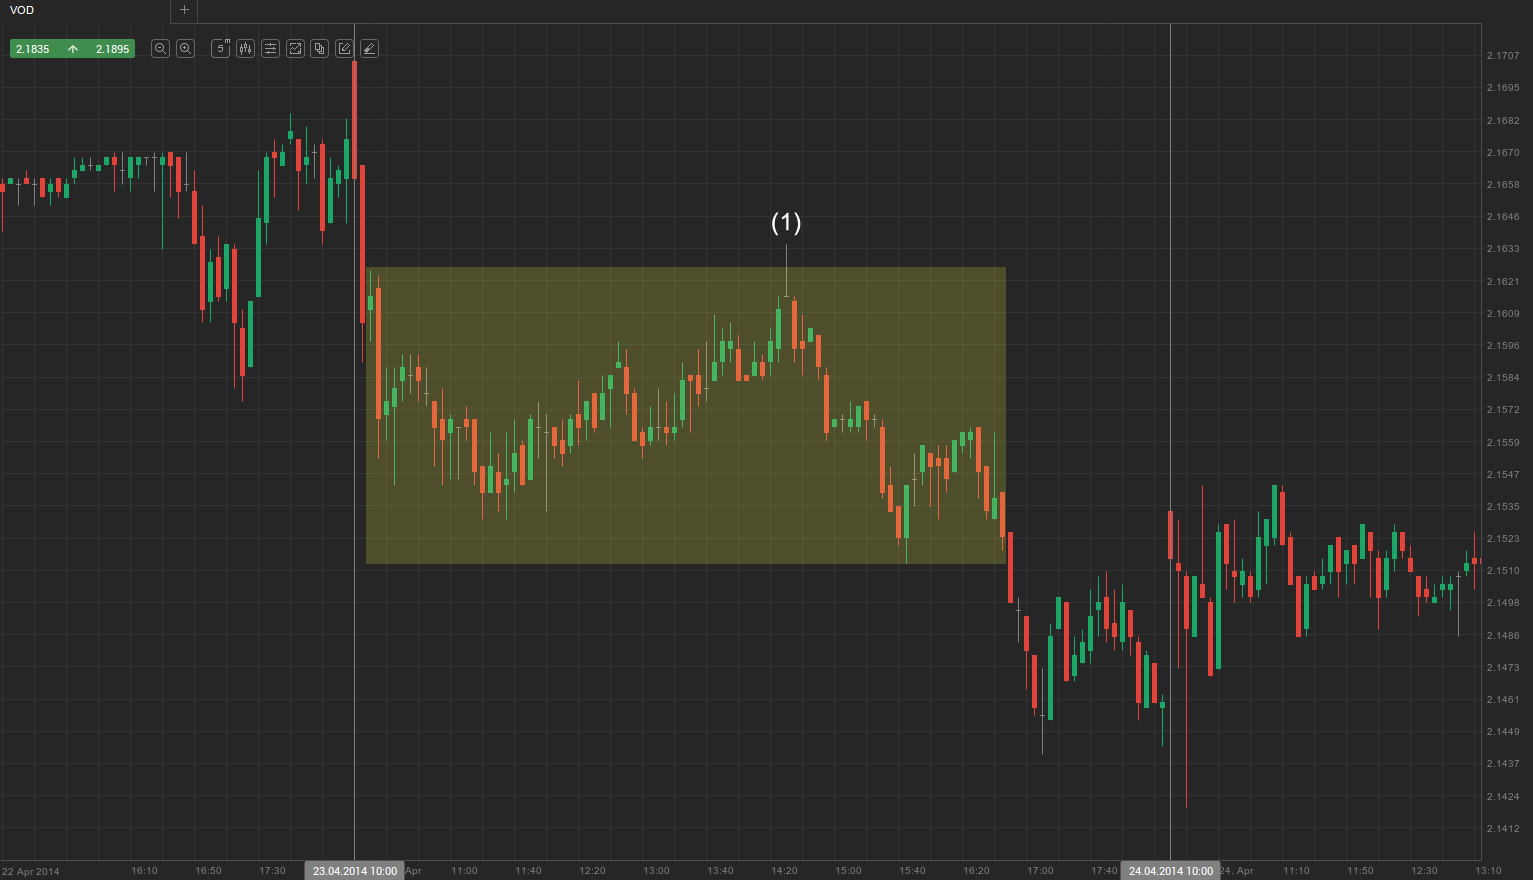
As you can see in the example above, the market opened with a significant sell-off comprising two consecutive sell climaxes, paused by the first bull trend. Another bearish trend bar followed, after which the three bullish bars – with shadows exceeding their bodies – and a doji presumably indicated that this might be a trending trading range day at most, if not a pure trading range day.
The market later formed an upward sloping trading channel which, however, did not display much upward pressure, as evidenced by the large number of doji bars within it.
As we’ve mentioned in the article “Overview of channels“, each channel, especially if showing signs of weakening momentum, can be viewed as a type of sloping trading range. Moreover, the high of the upward sloping channel at (1) marked the end of the correction after the day’s initial sell-off, after which the price edged lower but still remained within the day’s overall wide trading range, with the market persistently being two-sided. A breakout followed late in the day, but the price entered a lower trading range instead of beginning a strong trend.
In general, because both bulls and bears see value in the market on such days, the trading range’s vacuum effect causes the price to pull back to the breakout area. As stated in the previous article, as soon as the breakout reaches 50% of the average daily range, market participants counter-bet with strong trend bars, which might drive the market back up to the bottom of the initial higher range.
If the market re-enters the initial range, it will often test its top, especially if that happens in the final hours of the trading day. If the day closes at the top of, or above, the average daily range, it is considered a reversal day.