Trend reversal tests
This lesson will cover the following
- Tests of prior trend extremes can be two-legged
- The case with spikes
All trends end with a reversal (a move against the trend that breaches a trend line), after which the market tests the most recent extreme of the trend. This test usually overshoots the prior extreme (a lower low in a new uptrend and a higher high in a new downtrend) or undershoots it (a higher low in a new uptrend and a lower high in a new downtrend). An overshoot can be viewed as the final leg of the prior trend because it pushes the market to an even more extreme level. An undershoot, on the other hand, can be considered a pullback from the first leg of the new trend.
Tests of prior trend extremes can be two-legged
 A test may consist of two legs. Consider the following example. Near the market high, after the trend line has been breached, the price often surges once again in an attempt to reach even higher levels. However, the bears again manage to overpower the bulls around the same level as before. In this situation, buyers have tried twice to push the price higher, and both attempts have failed. As we have already noted, when the market tries to do the same thing twice and does not succeed, it will usually attempt to do the opposite.
- Trade Forex
- Trade Crypto
- Trade Stocks
- Regulation: NFA
- Leverage: Day Margin
- Min Deposit: $100
Because a counter-trend move that follows a trend line breach typically unfolds in two legs, a reversal to the upside that tests the downtrend low with a higher low may mark the start of the second leg. However, if the test occurs with a lower low, it may mark the start of the first leg; after this first leg, a pullback may follow and then a second leg. In the case of a reversal to the downside, a lower-high test would mark the beginning of the second leg, while a higher-high test would mark the beginning of the first leg.
The case with spikes

Sometimes the counter-trend move may be a powerful spike with no pullbacks. This spike may appear to signal a trend reversal, but the original trend may subsequently resume. If the resumption comprises enough bars and retraces a large portion of the spike, some traders may wonder whether this is a failed reversal rather than a pullback after an actual (successful) reversal. The extremes of most sharp moves that are followed by deep corrections are eventually tested and even surpassed.
Consider the following scenario. A huge move to the downside occurs, followed by an upward correction that retraces a large portion of the spike. This move is usually followed by another sell-off that tests the bottom of the first spike. From this point, the original trend may resume (forming a double-bottom bull flag), the reversal of the original trend may continue to the downside, or trading may move sideways.
The chance of a test is far greater if the sudden move occurs within a trading range or is in the same direction as the original trend (a spike down during a downtrend). A test is not likely to occur if it involves a counter-trend move during a strong trend (a sharp spike up during a strong downtrend may simply trap buyers and not be tested).
There are climax reversals that are not necessarily followed by a pullback testing the prior extreme. This may occur after an overshoot of the trend channel line and a reversal. Such climaxes are often seen on smaller time frames. For instance, a 1-minute chart may show several climax events each trading day.
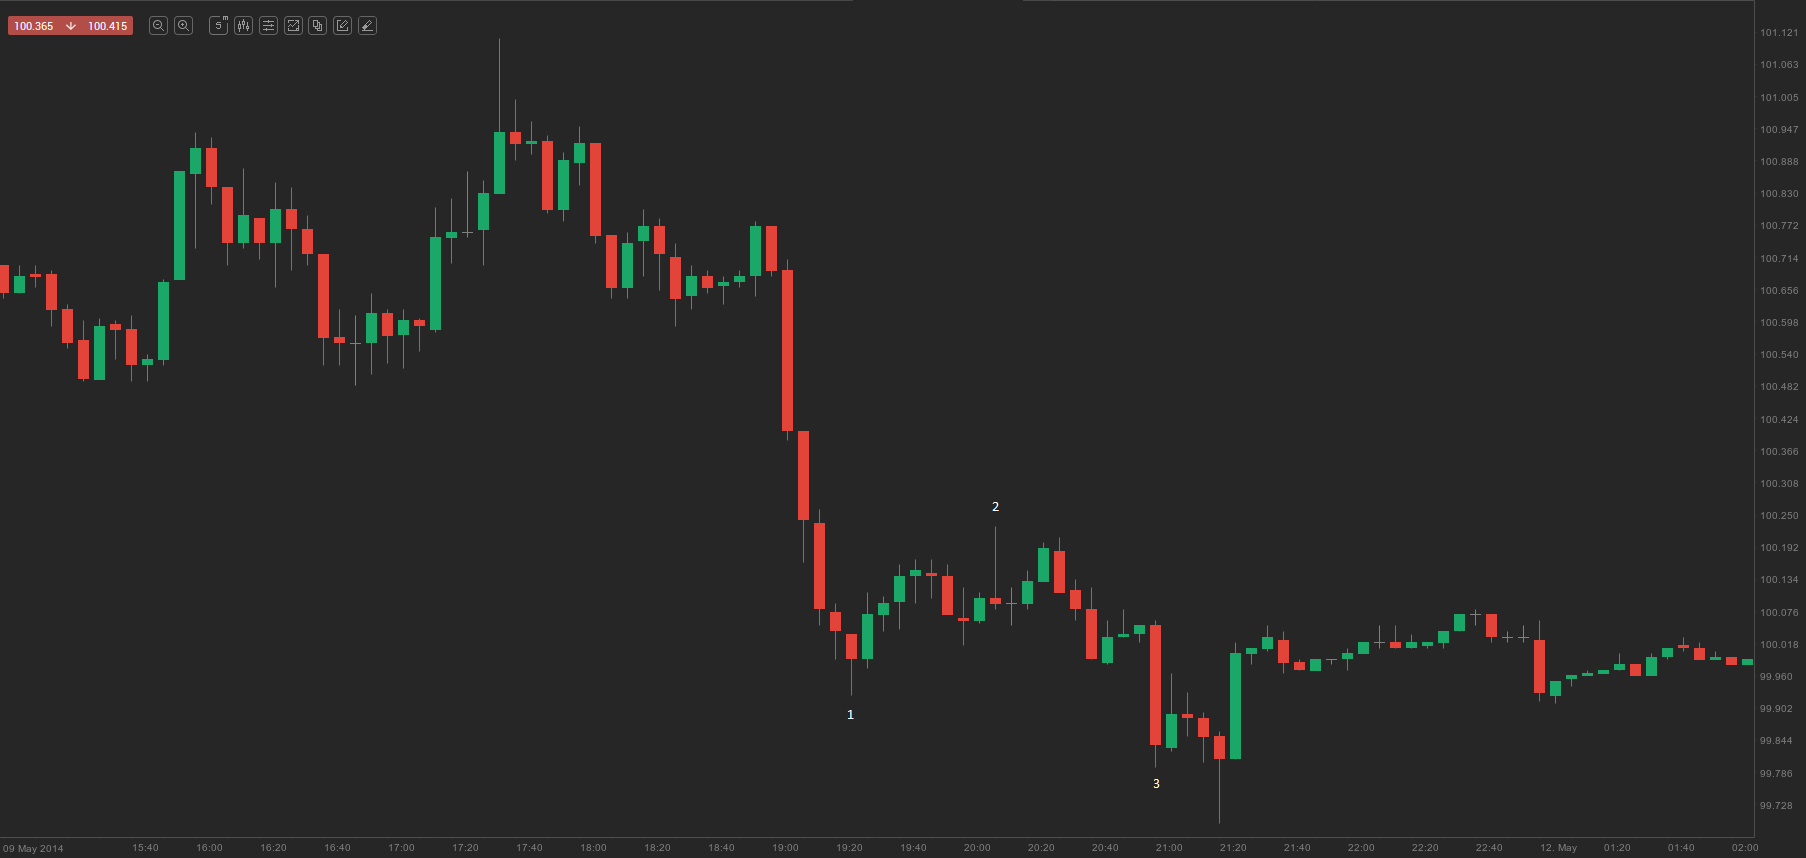
A sequence of trend bars with large bodies, small wicks and little overlap between them, followed by a pullback, almost always tests its prior extreme. On the 5-minute chart of crude oil above, bar 3’s low tested and exceeded the low of bar 1, but no actual reversal followed and the down-move lasted for a few more bars.
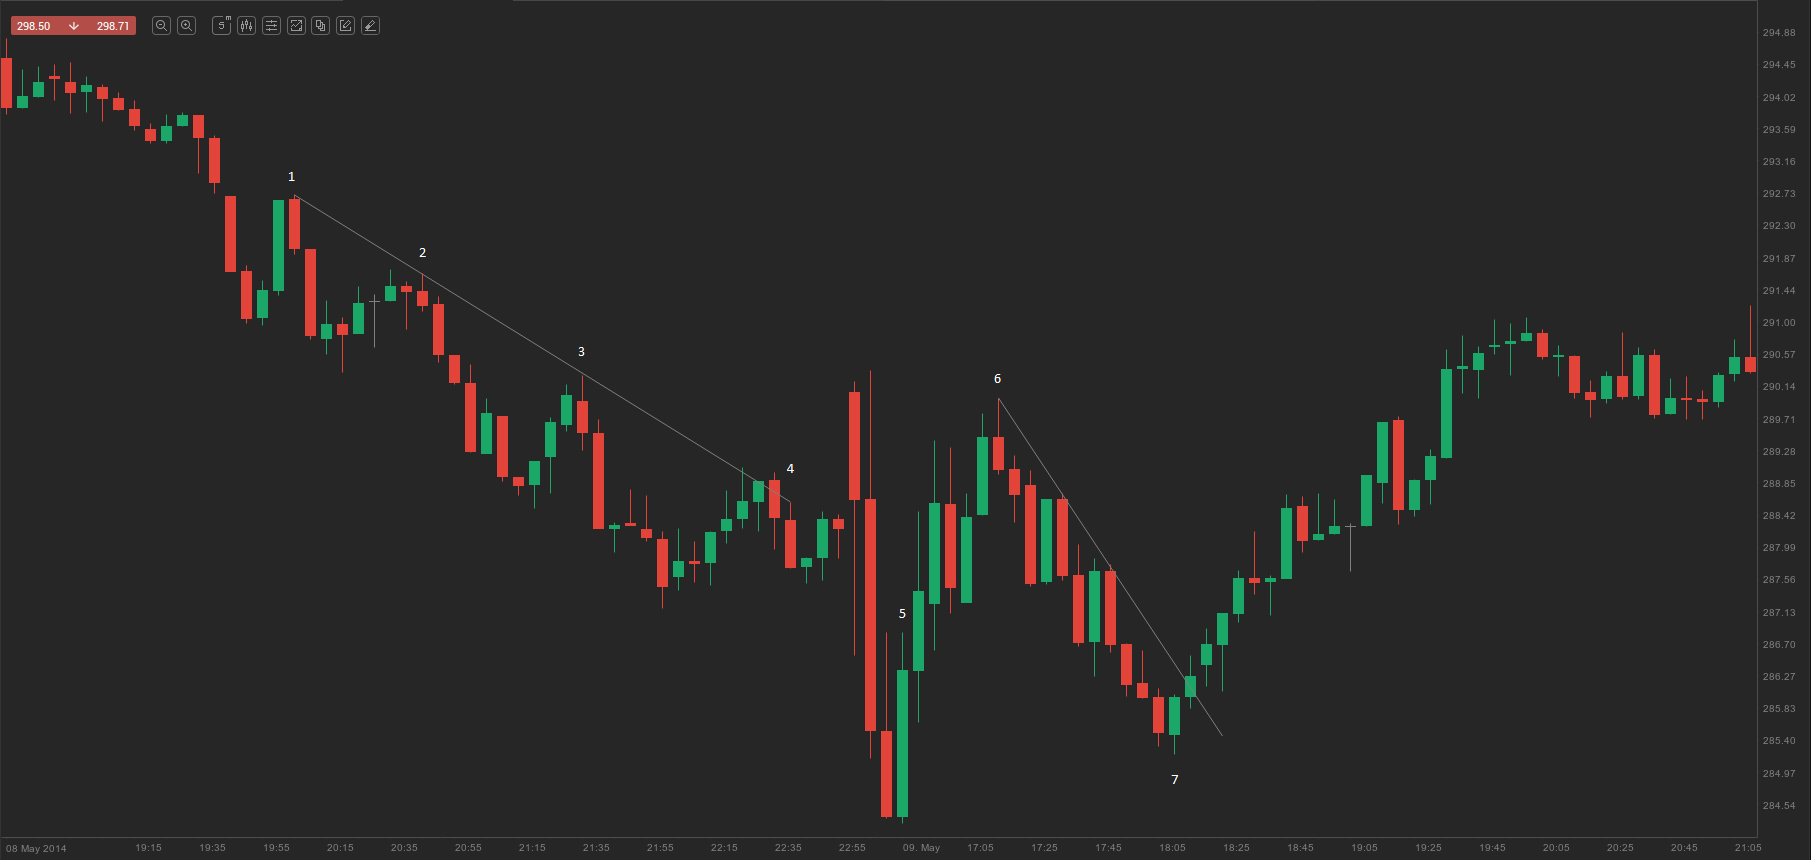
On the 5-minute chart of AMZN above, bar 5’s low tested and exceeded the previous low in the bear trend. A test by a lower low usually leads to at least a two-legged counter-trend move, and that is what happened here. There were two moves to the upside from bars 5 and 7. Bar 7 formed a higher low after the bear trend line from the previous trading day had been broken. As it was a higher low, bar 7 marked the start of the second leg, and the completion of that leg marked the end of the up-move. Bar 5 was a lower low after a key bear trend line breach, so it represented a ‘possible’ reversal of the underlying trend.