Trend lines in price action
This lesson will cover the following
- What trend lines are used for
- What trend lines tell us
- Positioning in regard to trend lines
- Successful and failed trend line breaks
As we’ve mentioned in the previous article “Basics of Trends and Trend Lines”, trend lines are a means used to better visualise trending market movement. They are plotted beneath or above the price action, depending on the trend. Trend lines can be drawn using three or more consecutive price extremes (highs or lows), but also using linear regression or through eyeballing (the best-fit technique).
The most commonly used method is connecting price extremes (swing points). However, if necessary, price-action traders use the best-fit technique when visualising wedges, and they tend to ignore the candles’ shadows, basing the figure on their bodies.
There is a reason why most tutors advise novice traders to always enter with-trend positions and never go against the market. The market spends more time forming new extremes in the trend’s direction rather than the opposite extremes. After a trend has been established, the most profitable trades are with the direction of the trend line, right after it has been tested.
Proper positioning
 You need to look for pullbacks to the trend line and position yourself accordingly. Each pullback gives you the opportunity to enter a with-trend position and ride the market, provided of course that there is no actual trend reversal. In some cases the market might not quite touch the trend line before reversing, while in others it might even penetrate it by a few pips (respectively called undershooting and overshooting the trend line) and then reverse. Even if the trend line is overshot, the market has a good chance of reversing back in the trend’s direction if the trend line is strong (i.e., it has contained market action for many bars).
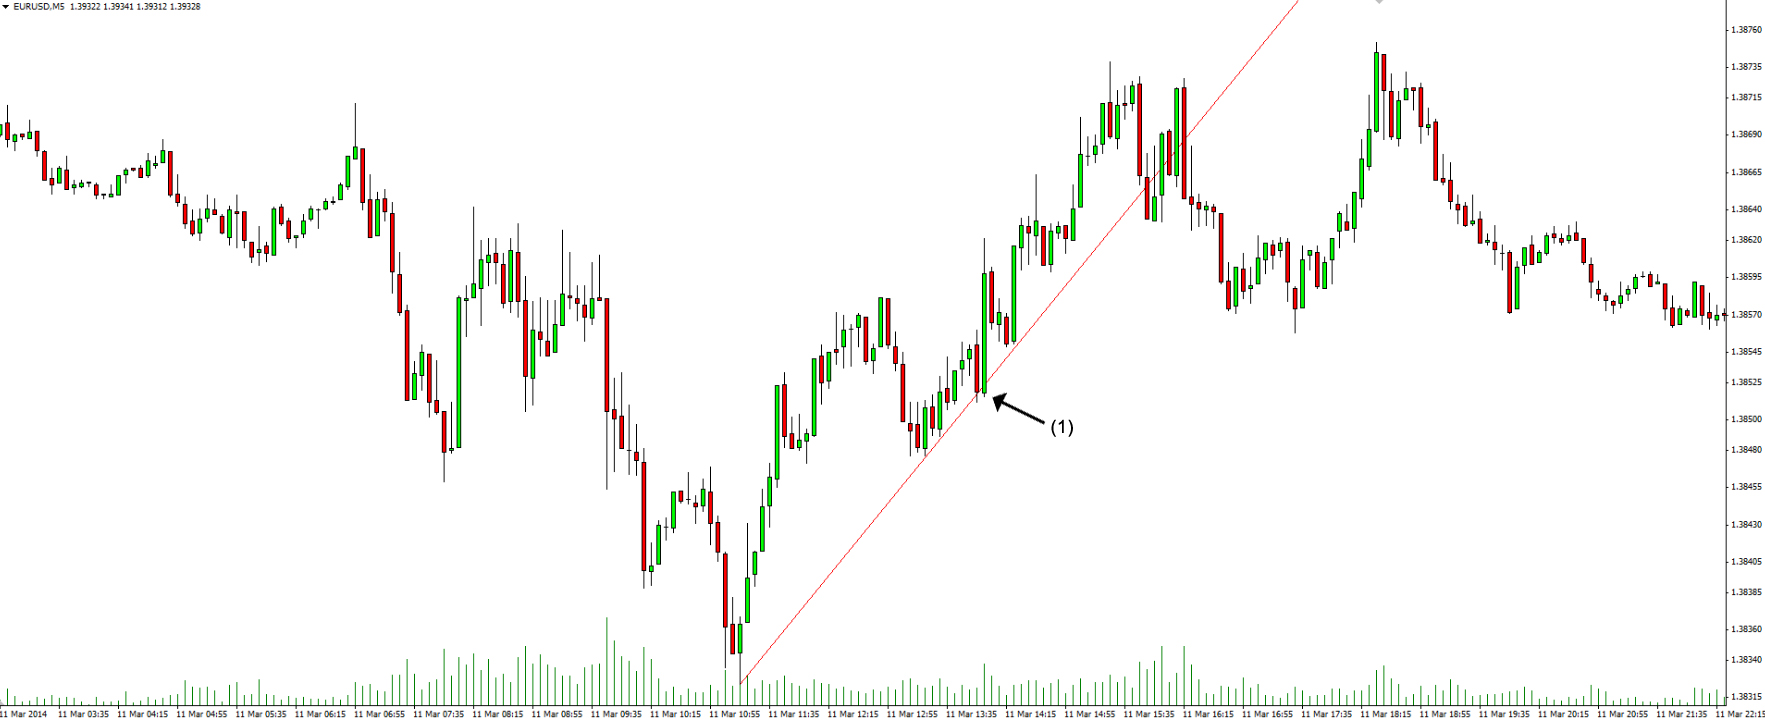
On the screenshot above you can see examples of both trend line undershooting and overshooting. The price action clustered around the trend line several bars before it was overshot at (1), indicating a zone where bears were applying heavy selling pressure. However, this was a very strong bullish trend. As soon as the bears tested the trend line once again and formed an outside down bar that overshot the line, they covered their shorts and the bulls pushed the market up, forming the largest candle in the trend and hitting a new extreme. You can also see that the trend line was undershot several times, but the subsequent rebounds were not as impressive.
 This is the point at which many novice traders decide to play against the market – and fail. As the price repeatedly reverses towards the trend line in an attempt to break it, inexperienced traders can be lured in by a strong pullback. Ignoring what has happened in the previous 10 or more bars, they enter counter-trend positions, hoping they have anticipated the formation of a new trend and will therefore profit throughout the supposed new move.
- Trade Forex
- Trade Crypto
- Trade Stocks
- Regulation: NFA
- Leverage: Day Margin
- Min Deposit: $100
If the current trend is bullish, novice traders will sell above, at, or a little below the bull trend line, disregarding both the prevailing trend and the risk and thinking only about what they might gain. They believe that even if things turn out badly, the market will at least have a second leg down that will allow them to exit the position at breakeven or with a minor loss.
Experienced traders do exactly the opposite. They place limit orders or market orders to buy at, or a bit below, the trend line, relying on the current trend’s strength and anticipating a rebound from the trend line towards the trend extreme. In a bull trend, for example, the market often needs to fall beneath the trend line after a sell-off so that it becomes clear where bulls and bears stand; yet most of the time the bulls regain control and the trend resumes. After all, we’ve said numerous times that trend reversals fail most of the time.
Sentiment providers
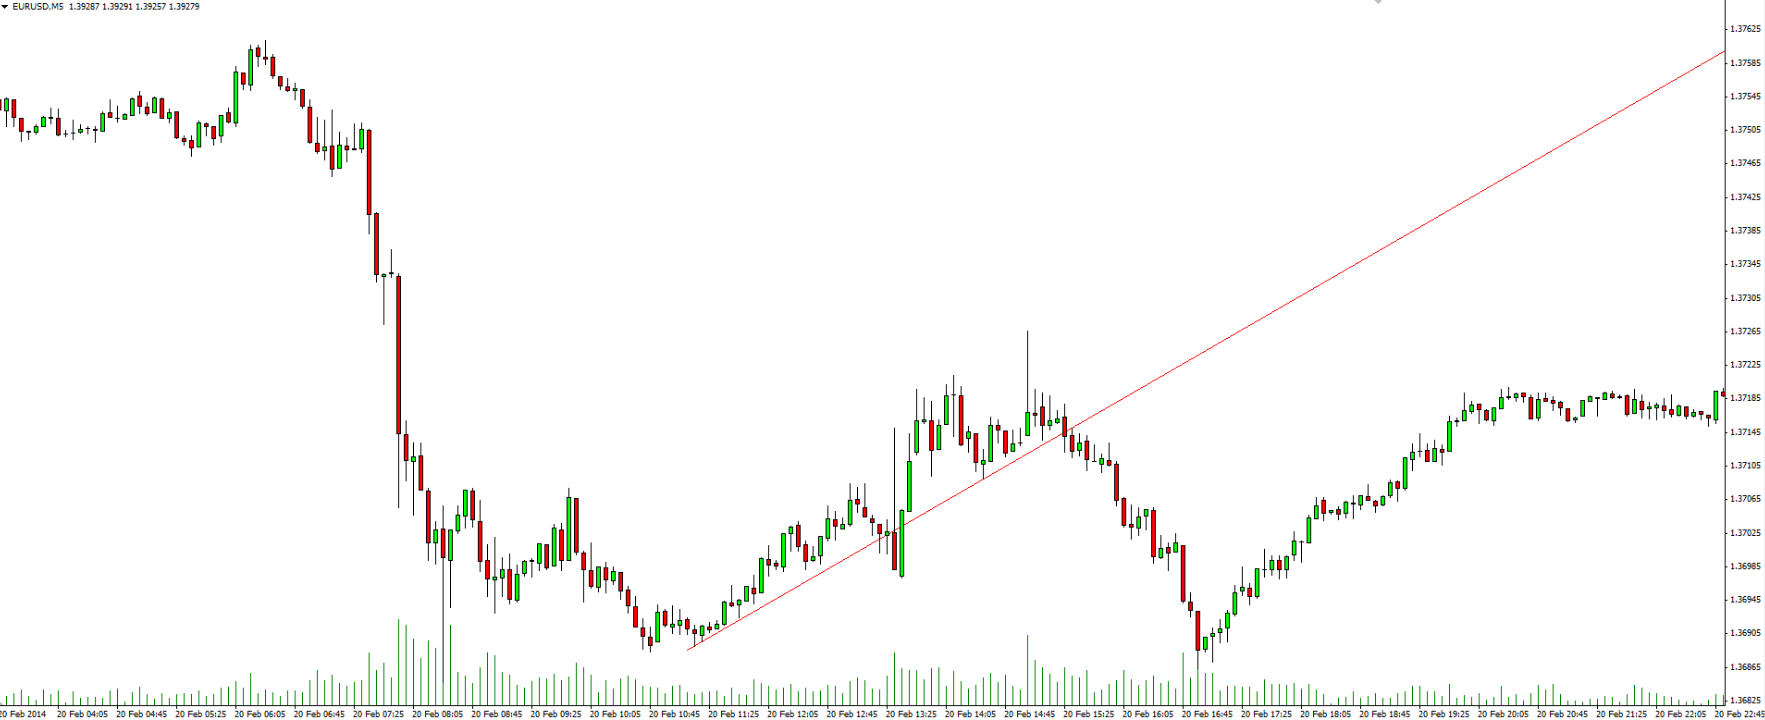
 What is important to remember about trend line breaks is that, even though they often fail to reverse the trend, they visualise the first point during the trend at which the market was not controlled solely by the bulls or the bears. The strength of the break also shows how strong and decisive the counter-trend traders are, but that strength is unlikely to emerge on the first attempt. After a trend line break, the market often retests the trend’s extreme, for example by dropping to a lower low or a higher low relative to the bearish trend’s extreme, and vice versa. On the screenshot below you can see how the trend rebounds with an almost double-shaved bar to a new high after a trend line break.
Keep in mind that when it comes to a trend channel, many traders actually prefer a trend channel break before looking for a reversal that would penetrate the other side of the channel as a minimum profit target.
If you draw a new trend line from the initial one’s starting point through the newly formed break, you will see that the new line has a shallower slope than the first. Each successive break will produce a new trend line with a flatter slope than the preceding one, indicating a loss of momentum. If the market continues to experience further breaks, it will eventually reach the point at which the opposite trend lines become more significant, signalling that the initial trend has reversed or has at least entered a trading range.
However, be careful when drawing multiple trend lines to visualise breaks and reversals, because they can clutter your chart and distract you from the actual price action. Use trend lines only to observe how a bar behaves near the line, not as the sole basis for your decisions.
Two outcomes
 When the price action clusters near the trend line and retests it many times within a short period, there are two possible outcomes. The price will either break through the line and attempt to reverse the trend – the most common scenario – or it will discourage the counter-trend traders and force them to give up, resulting in a strong acceleration of the trend towards its extreme.
Although successful trend reversals are much rarer than failed ones, very intense testing of the trend line means that the with-trend traders are barely managing to hold their ground against the counter-trend traders, creating small trading ranges within the larger trend.
In the second scenario, repeated retesting of the trend line often results in the price bouncing off it and accelerating towards the trend channel line as the counter-trend traders finally capitulate. If it is a bearish trend, they will exit their long positions at a loss and refrain from entering in the same direction until the market has dropped significantly. They aim to repeat the exercise and go long again as soon as the price touches or overshoots the trend channel line. Check out the following example.
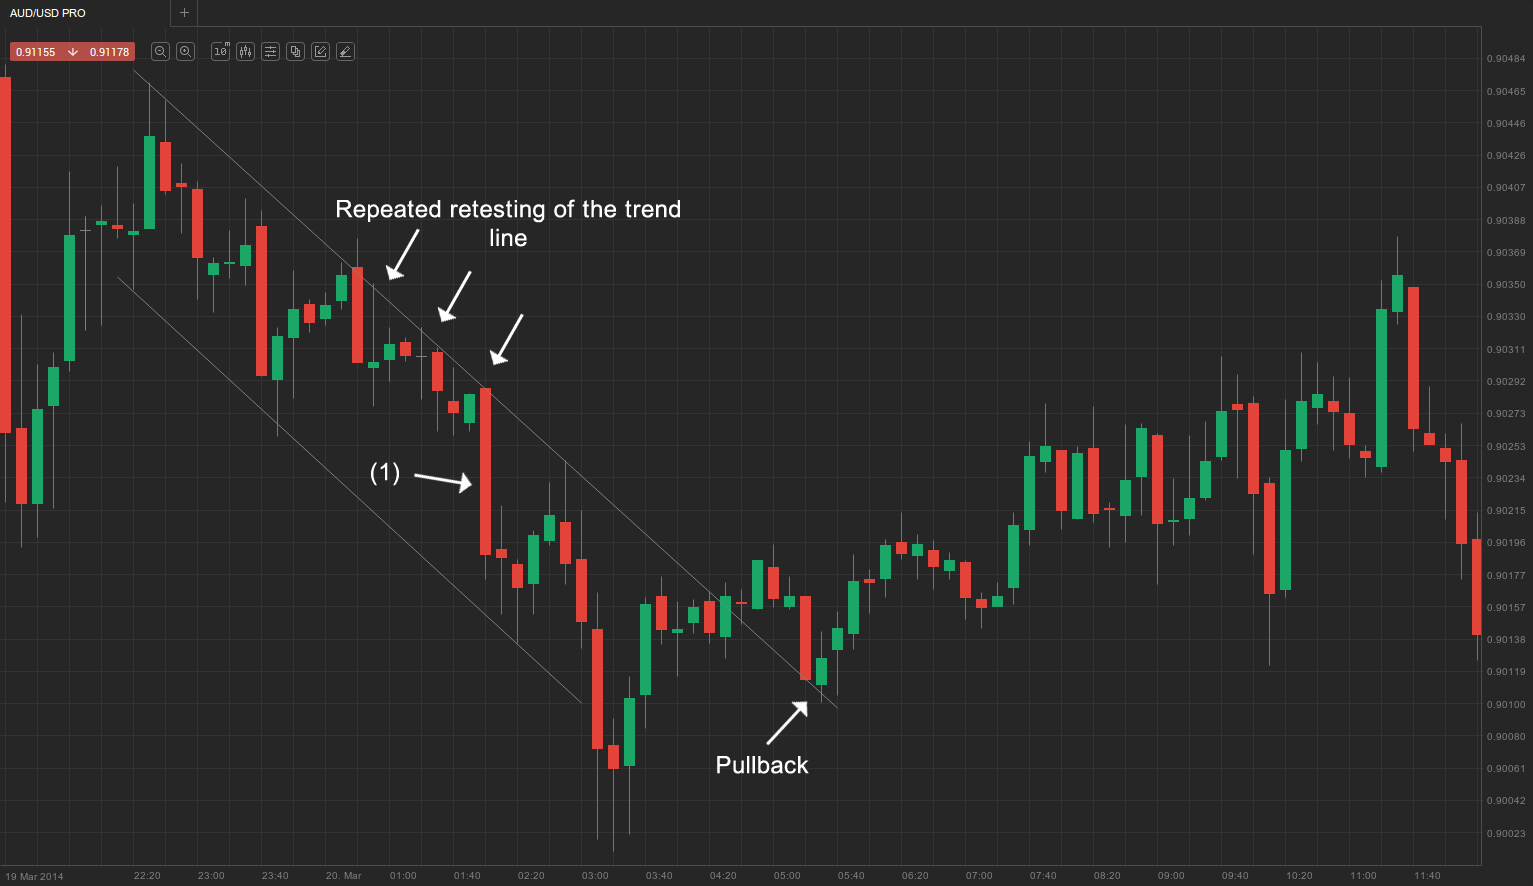
On the screenshot above you can see that the price repeatedly retested the trend line and effectively created a small trading range within the bear trend, including a perfect doji bar. After several attempts by the bulls to break the line and reverse the trend, they gave up and sold their long positions, which, coupled with other traders’ short orders, resulted in a large bear trend bar marked as (1). After the sell climax, the bulls entered the market again at the trend channel line and pushed the price towards the trend line, which, however, was followed by another sell climax that broke through the trend channel line.
If the price fails to break through the trend line and drops towards the trend channel line in a bearish trend, the latter is often penetrated (the opposite is true in a bull trend). When that happens, you should watch for a reversal back to the top – a rally that can even test above the trend line. This area interests traders and can become a trap for newcomers who believe that the trend line cannot be broken and therefore go short near it. However, once the price recovers from a trend channel line break, especially after a sell climax, it can rocket upwards and ignore the resistance role of the trend line.
That is exactly what happened in our example. The price penetrated the trend line and later pulled back with a double-shaved bear trend bar only to hit the trend line, which, once a resistance, now acted as support. Instead of breaking back below the line and resuming the downward trend – something that would have appeared as a two- to three-bar trend line break on a higher time frame – the market found solid buying support and completed a strong bull breakout above the descending channel.