Trend channel lines in price action
This lesson will cover the following
- Basics of trend channel lines
- Reversals
- Common mistakes novice traders make
As we’ve mentioned in the article “Basics of trends and trend lines”, a trend channel line is drawn on the opposite side of the price action from the trend line; together, the two form a channel that contains the market movement until a breakout occurs.
The slope of the trend line and the trend channel line may vary: they can be parallel, convergent – forming descending triangles – or divergent – forming ascending triangles.
Trend channel lines most often generate counter-trend entry points, since they act as resistance in uptrends and support in downtrends. When the price overshoots the trend channel line and reverses, it makes for a good point to fade the trend (bet against it) because it shows the trend has accelerated too fast. A reversal from a second consecutive overshoot is even more reliable.
 There are several ways for a trend channel line to be plotted. First, you can duplicate the trend line and carry it over to the other side of the price action. Second, you can draw it on the other side of the price action with no regard to the trend line by connecting at least two price extremes. Third, you can use the best-fit technique we mentioned in an earlier article.
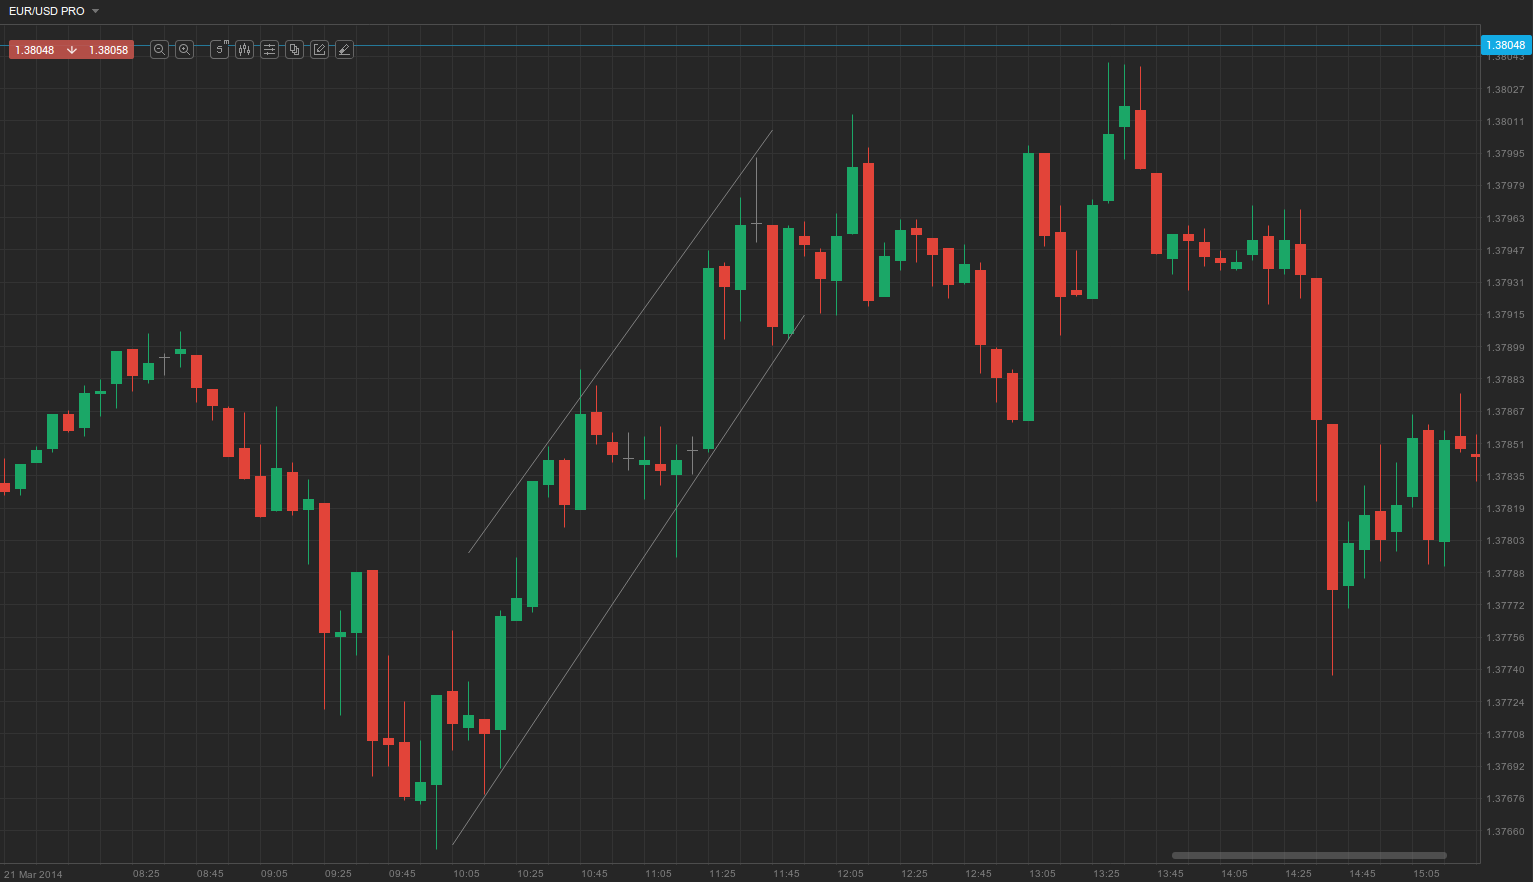
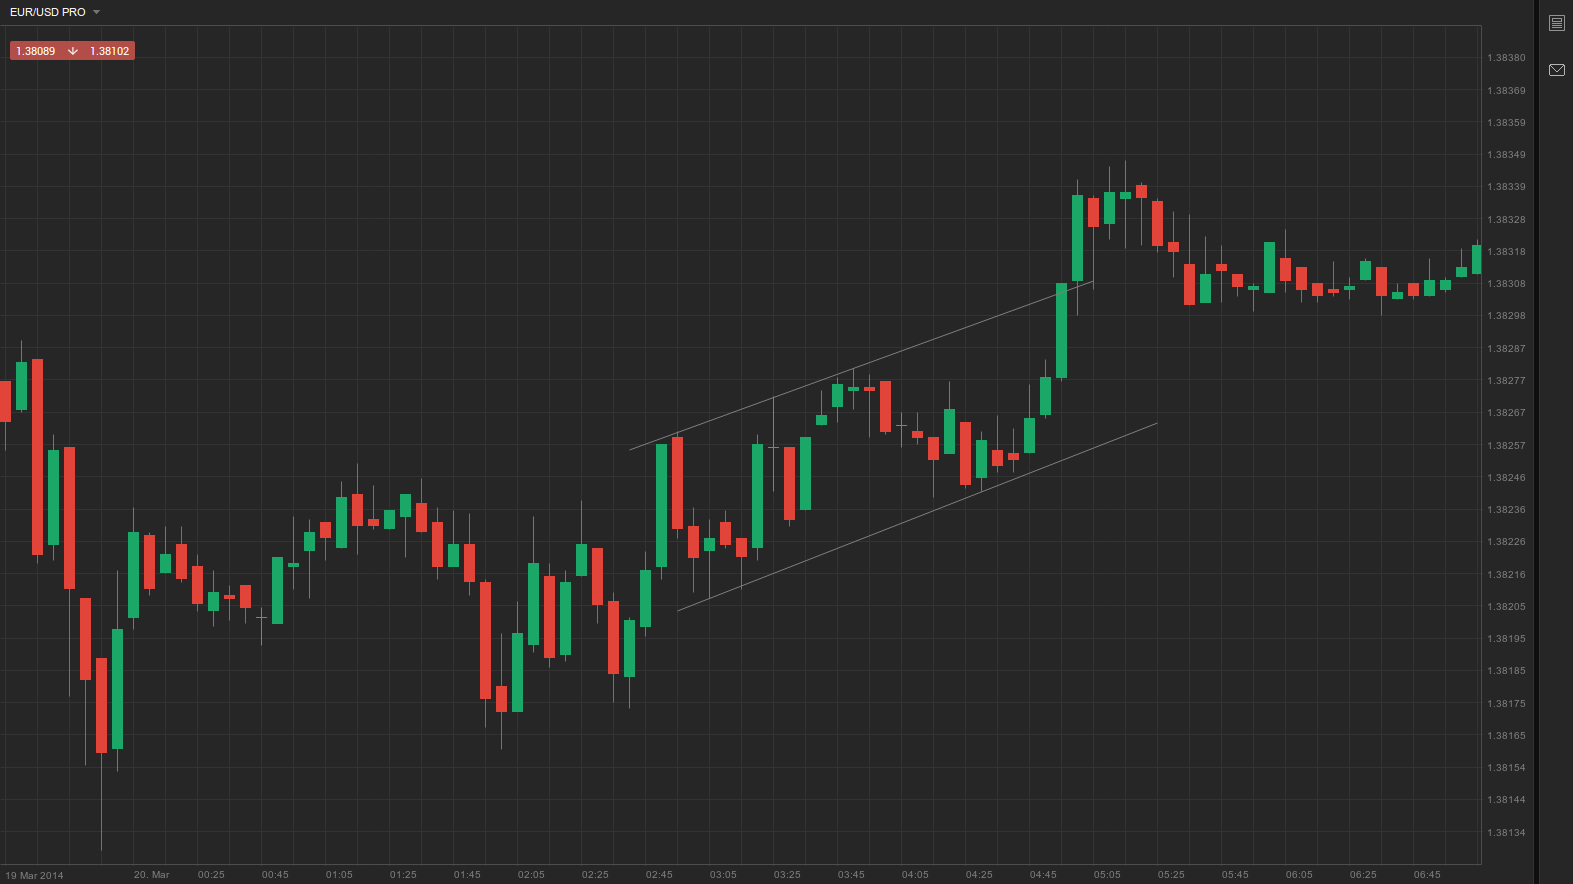
Different traders’ methods of drawing trend lines vary, but you should at least aim to place your trend channel line so that it contains the opposite price extremes within the interval of those used to draw the trend line. We’ve said earlier that you should use at least three price swings for the trend line and at least two for the trend channel line. This means that in an uptrend, you will need at least three lows and two highs. Therefore, in theory, the trend channel line should connect at least two highs that are within the interval of price movement between the three lows. Here is an example.
Sometimes there might be a single swing that distinctly exceeds the rest and doesn’t fit the tighter channel. This should usually just be ignored, but keep in mind that in some cases the market might later form new extremes at roughly the same level, meaning that you should switch to using that new trend channel line.
Reversals are imminent
 Generally, each channel that slopes upwards should be seen as a wedge (even if it is not that apparent when it is made of two parallel lines instead of sloping ones); therefore, it is almost inevitable that the price will break through the bottom of the channel (the trend line) in an uptrend, and vice versa. After the breakout, the price can either reverse and enter a bearish trend, or the market can go sideways. In some cases, the price might not break through the bottom of the channel, but rather accelerate very fast and break through the trend channel line, marking a very distinctive price rally, which can end in one of the same two scenarios – trend reversal or trading range. Logically, this is true for downtrends as well. In the following example you can see an ascending channel whose trend channel line was penetrated by a buy climax, after which the market entered a trading range.
Trend channel line overshoots are closely related to wedges. In most wedge formations you can see that failed breakouts through the trend channel line have triggered a reversal, and most trend channel line overshoots and reversals are wedge reversals.
Predictable or not?
You might then ask: if reversals after a trend channel line overshoot are so common and everyone knows about them, why do they keep occurring? The answer is simple – inexperienced traders. By default, novice traders on the wrong side of the trade abstain from cutting their losses short and hold their positions longer, hoping the market may reverse in their favour, up to the point they can’t withstand any more losses. As all of them suddenly exit their positions at once, this causes the overshoot.
For example, in a bullish trend, as the market moves up towards a resistance level and penetrates it even by a little, trapped inexperienced shorts who had been hoping for a miracle close their positions because they can’t bear any more pain. As they cover their short positions, this pushes the market up, luring in another set of novice traders who, however, think that the trend channel line break is actually a proper breakout, and so they go long. Their orders add to the sudden upward move that breaks through the trend channel line, which causes any remaining trapped shorts to exit the market, further adding to the momentum. This is basically a self-sustained buy climax up to the point where all the shorts have exited the market and there are no more new longs, because they realised (with delay) that they have just bought at the peak of a buy climax and will sell in panic. Because there are no shorts left in the market and the bulls exit their positions, the market is quick to pull back.
This is the point where experienced traders step in. Practice makes perfect and people who have previously traded such a scenario know that they shouldn’t bet counter-trend before a pullback from a trend channel line overshoot or a trend line break occurs. In our example, experienced market players will buy (or sell in a bearish trend) until they push the price to the trend channel line, at which point they will lock in their profit.
- Trade Forex
- Trade Crypto
- Trade Stocks
- Regulation: NFA
- Leverage: Day Margin
- Min Deposit: $100
If you find yourself in a position where the market keeps forming higher highs that don’t match your trend channel line, then you are probably placing the wrong bets. If you are attempting to trade against the market (in our example of a bullish trend you are trying to short and bet on a reversal) but that reversal doesn’t come and the trend gets stronger, then you should probably give up. As we’ve said before, you should abstain from trading counter-trend unless there is definitive proof the market has reversed or after a pullback from a strong trend line break or trend channel line overshoot.
At some point market participants will reach a mutual agreement on where the trend channel line should stand and a convincing reversal will form. Until then you should trade only with the trend.
Once the market has reached a consensus that the price has hit a high, experienced long traders will immediately exit positions, locking in profits, and will then go short. Moreover, players who were outside the market until now will also join and go short. Experienced traders who are convinced this is a point of reversal will even hold on to their shorts, even if the price manages to edge a bit higher. Not only that, but they will add to their positions at the new top so that they average up their position and profit even more from the reversal to come. This applies further downward pressure and, as soon as all big players turn bearish, the market will fall.