Trend channel line overshoots leading to reversals
This lesson will cover the following
- Wedge-shaped patterns
- How they can be traded
Wedge-shaped patterns
 All trends may end with a test of the prior extreme level, and the test itself may be two-legged. Each leg may lead to a new extreme (in the case of an uptrend – a higher high, and in the case of a downtrend – a lower low). The initial extreme level and the following two legs form three swing levels, collectively called a reversal setup, though it may be named differently. This setup often has a wedge shape.
Many of the three-swing-point setups lead to a reversal after they overshoot a trend channel line. This overshoot is the only reason for a trader to enter the market, even though the shape of the pattern may not exactly resemble a wedge. Sometimes the three swing points are easier to spot than the actual trend channel line overshoot. It is rare for these setups to have a perfect shape and this requires adjustment of trend lines and trend channel lines if one is to identify the pattern. At times, for instance, a wedge pattern may be formed using the bodies of candles, and in such a case drawing the trend line and the trend channel line requires the trader to ignore candle wicks. In other cases the end point of the wedge may not reach the trend channel line.
If a wedge pattern prompts a trader to enter the market but the entry fails (the price moves beyond the wedge extreme), this movement may be a measured one, almost the same height as that of the wedge. At times, immediately after the price exceeds the wedge extreme, it may retrace briefly in a second attempt to reverse the trend. If a reversal does occur, the new trend may last for at least one hour and comprise at least two legs.
- Trade Forex
- Trade Crypto
- Trade Stocks
- Regulation: NFA
- Leverage: Day Margin
- Min Deposit: $100
The third swing point may undershoot the second, thereby forming a double-top pattern. It is traded in the same way – as a reversal. If the third swing point undershoots the second significantly, a head and shoulders formation appears.
How to position yourself
 In terms of trading, bears may enter on a stop order at one cent below the failed breakout bar (close to the upper area of the range). Bulls may enter on a stop order at one cent above the failed breakout bar (close to the lower area of the range). A trader should keep in mind that a breakout beyond any swing high or swing low (even if it belongs to an earlier and opposite trend) implies strength and provides a potential trading opportunity.
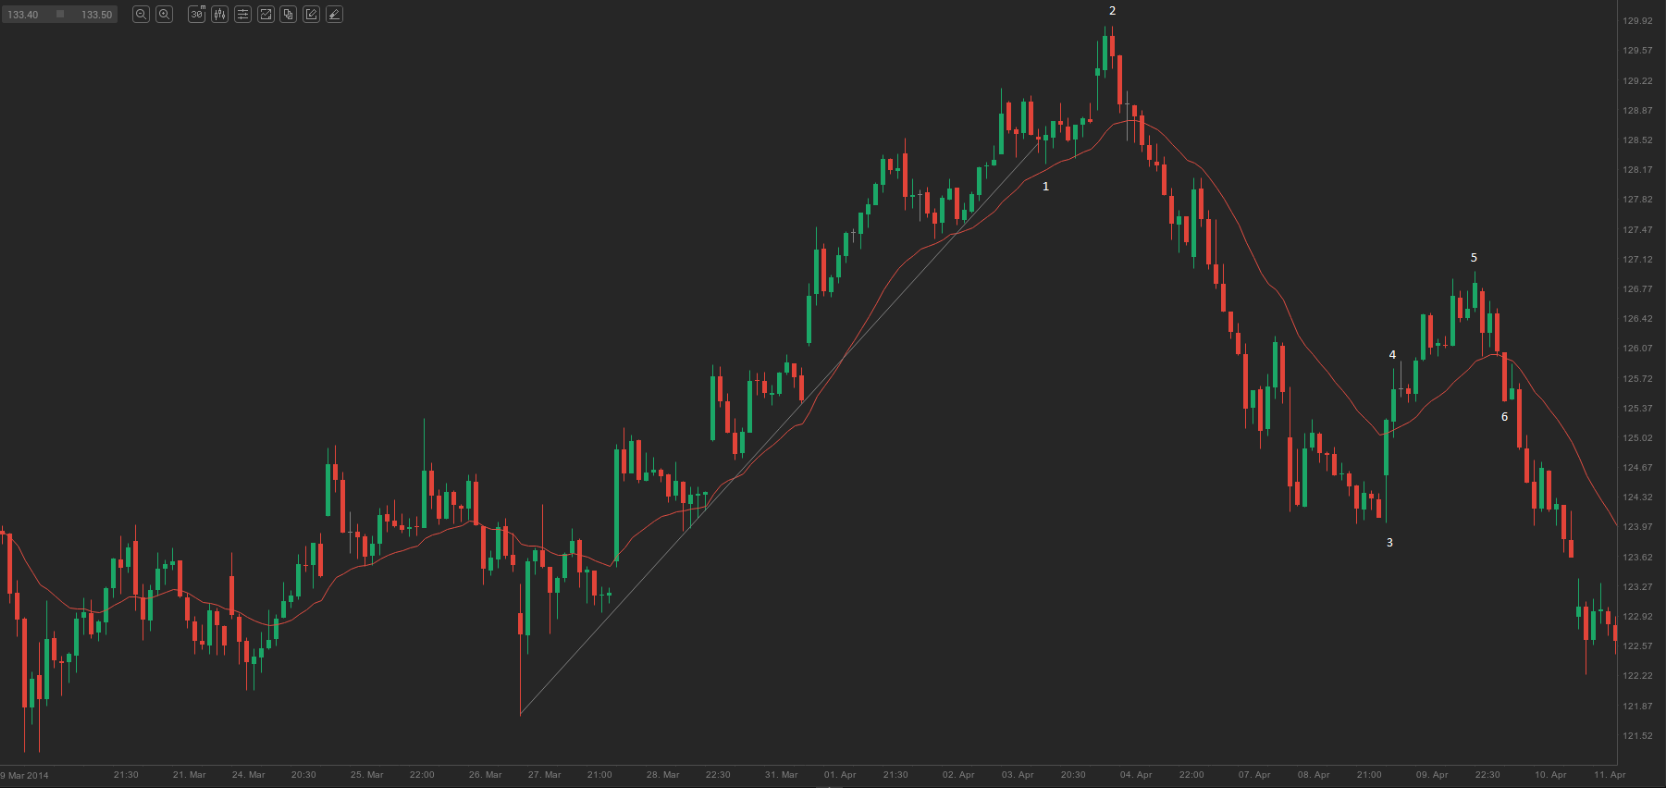
On the 30-minute chart of BA above, the move down to bar 3 breached a key bull trend line that was also far below the exponential moving average. After that, an up move with three swing points led to a lower high at bar 5. Bar 4 was an M2B setup, while bar 6 was an M2S setup, after which the second leg of the downtrend continued.
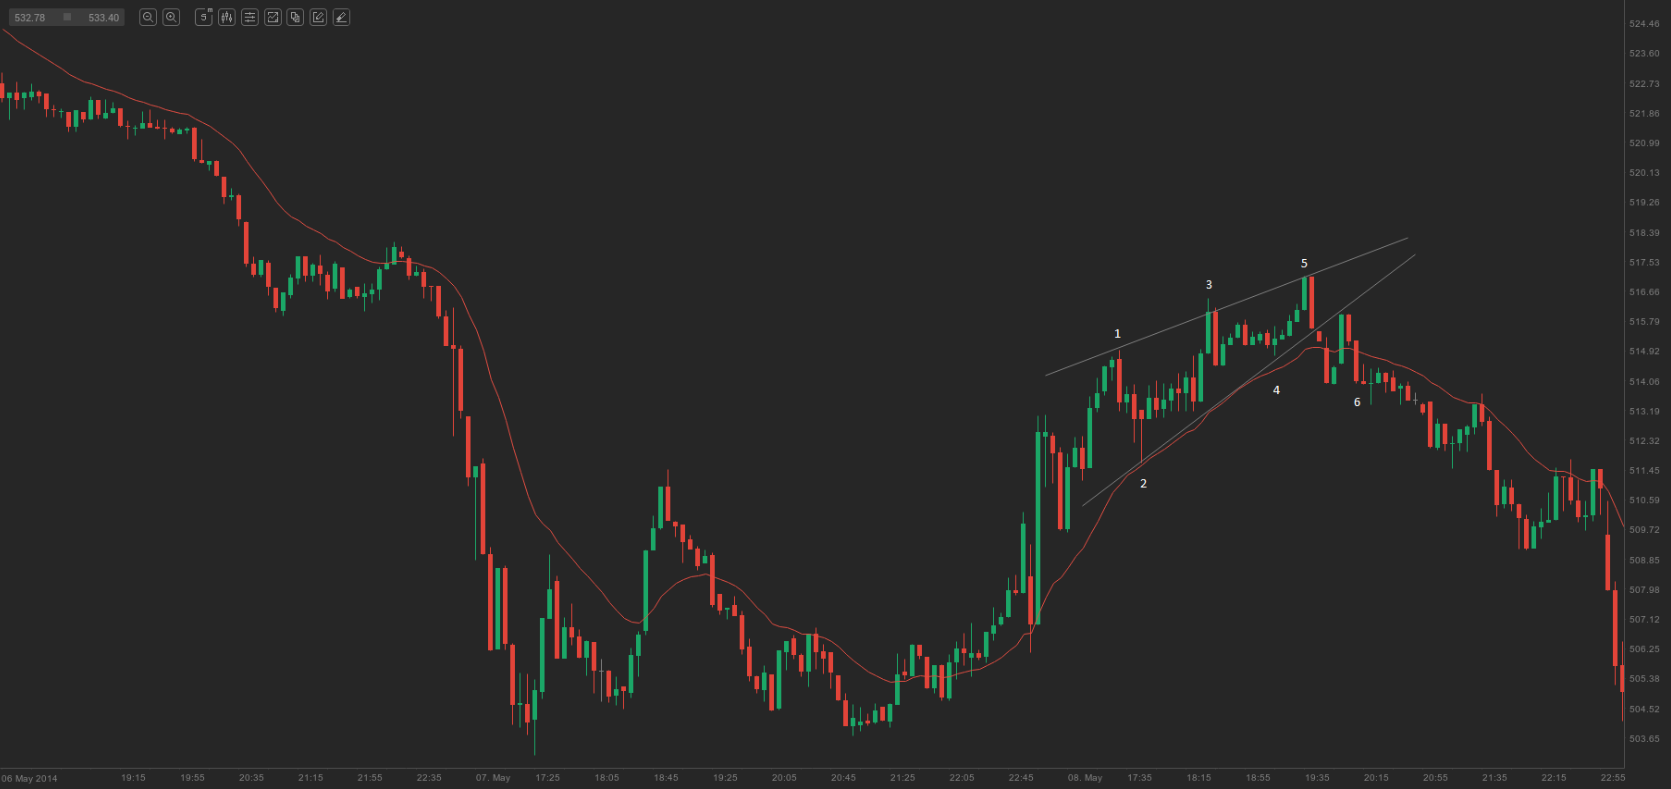
On the 5-minute chart of GOOG above, bars 1, 3 and 5 formed a bullish wedge, while bar 3 overshot the trend channel line, signalling a short entry. Bar 5 also slightly overshot the trend channel line, thus providing another short entry signal. Since it was a rising wedge, the breakout occurred to the downside. Bar 6 was an M2S setup. It can also be viewed as a bear spike, followed by a bear micro channel.