Support and resistance levels in weak trends
This lesson will cover the following
- Horizontal lines during weak trends
- How to benefit from them
- What to bet on during strong trends
Very often, you will see the market displaying ranging behaviour, and when it is trending, it is likely to be a weak, less distinctive trend. Strong, long and sustainable trends that do not show climactic behaviour are not that common, which means that you need to be wary when prices reach support and resistance levels because they tend to trap less-experienced traders.
During range-trading days, you should expect that horizontal lines drawn through swing highs and lows (essentially support and resistance levels) will cause prices to rebound and keep the price action contained within the range.
![]() You should be aware that breakouts above swing highs most often fail. While testing resistance, price action tends to mark a new high (a higher high), which then acts as a turning point for the subsequent reversal. In the same way, swing-low breakouts often fail, resulting in the formation of a lower-low reversal.
You should be aware that breakouts above swing highs most often fail. While testing resistance, price action tends to mark a new high (a higher high), which then acts as a turning point for the subsequent reversal. In the same way, swing-low breakouts often fail, resulting in the formation of a lower-low reversal.
Sometimes, however, the market does not reverse immediately after the higher high or lower low; in other words, the breakout failure itself fails. Instead, the market forms a second, more extreme higher high or lower low. This gives us an even better opportunity to trade against the current movement, because it represents a second attempt to reverse the market, and second-entry signals are more reliable during trading ranges.
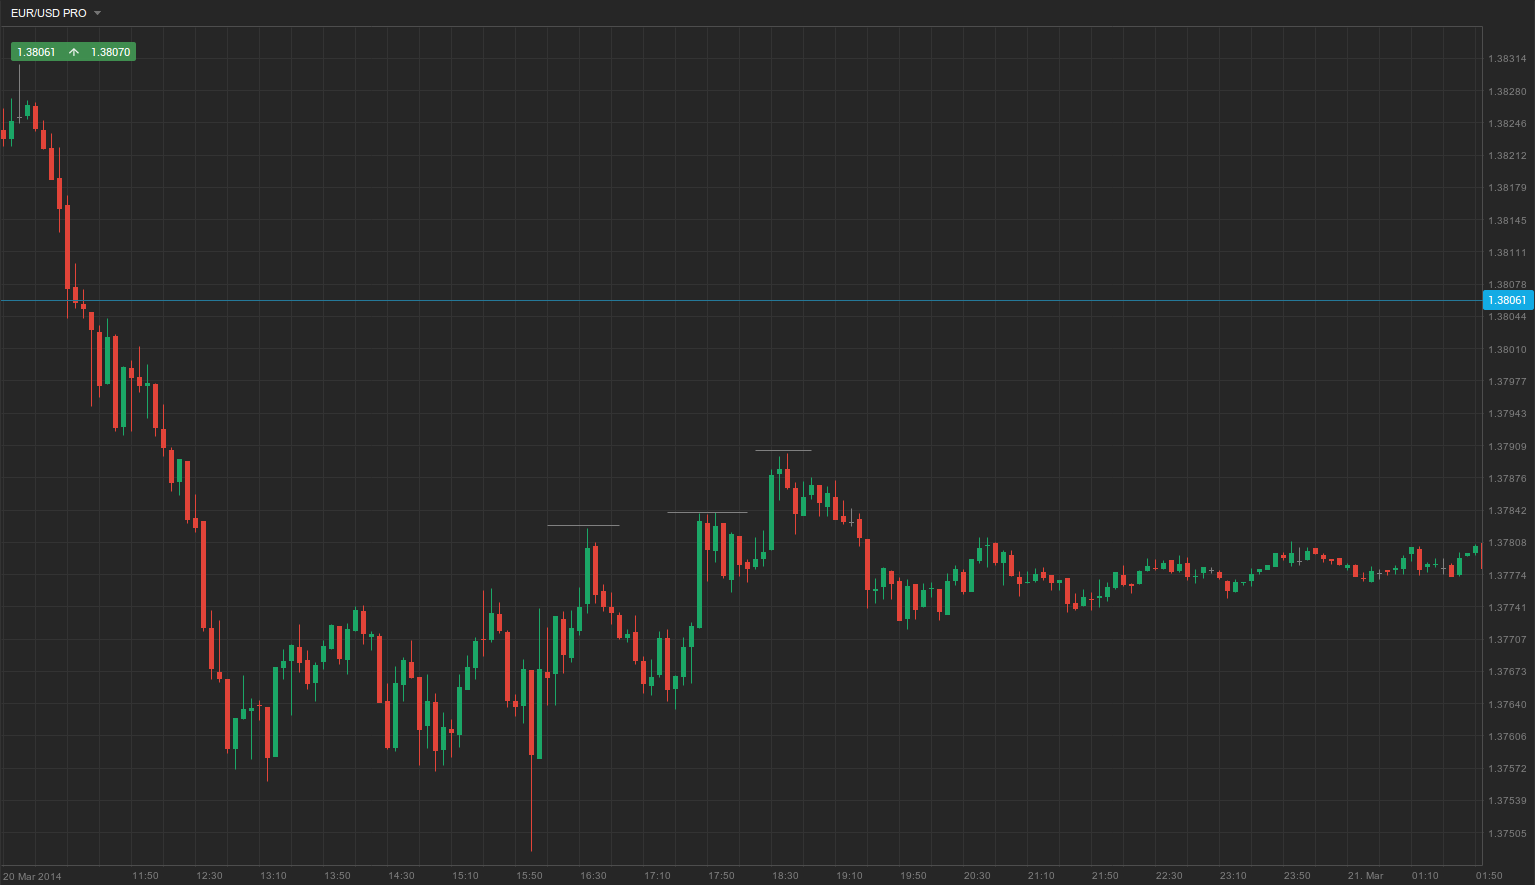
You can see in the screenshot above that the market entered a trading range after a very strong downtrend that ended with a sell climax. Later, it reversed after a swing high. It then formed a higher high, but price failed to reach the previous low and instead produced a second higher high after a brief range. This second higher high was followed by a more pronounced downswing, which would have been a good opportunity for a short scalp.
- Trade Forex
- Trade Crypto
- Trade Stocks
- Regulation: NFA
- Leverage: Day Margin
- Min Deposit: $100
Traders should always watch for support and resistance zones during ranges so that they can spot failed breakouts and enter on reversals – preferably on second signals. Because second signals mark a reversal from a more extreme level, they give us a better chance to scalp a profit.
Be careful with strong trends as well
During strong trends, you should be very careful and generally abstain from entering counter-trend positions.
 When the market is trending, use support and resistance levels to enter with-trend positions on pullbacks. For example, if there is a strong breakout to the upside from a trading range that forms part of a larger bullish trend, the market will often pull back towards the resistance line, which now changes role and acts as support, propelling the market higher. If a bull-reversal setup appears on the retest of this line, a long entry would be sensible, and vice versa.
If, however, you decide to trade against the trend, you should filter your entry points and stick only to scenarios in which there is a clear trend-line break or a trend-channel overshoot accompanied by a strong reversal bar. Counter-trend positions, especially during very strong trends, should generally be limited to scalps. Do not waste too much time on them; instead, keep your attention on with-trend entries, which have the potential to provide greater profit with less risk.
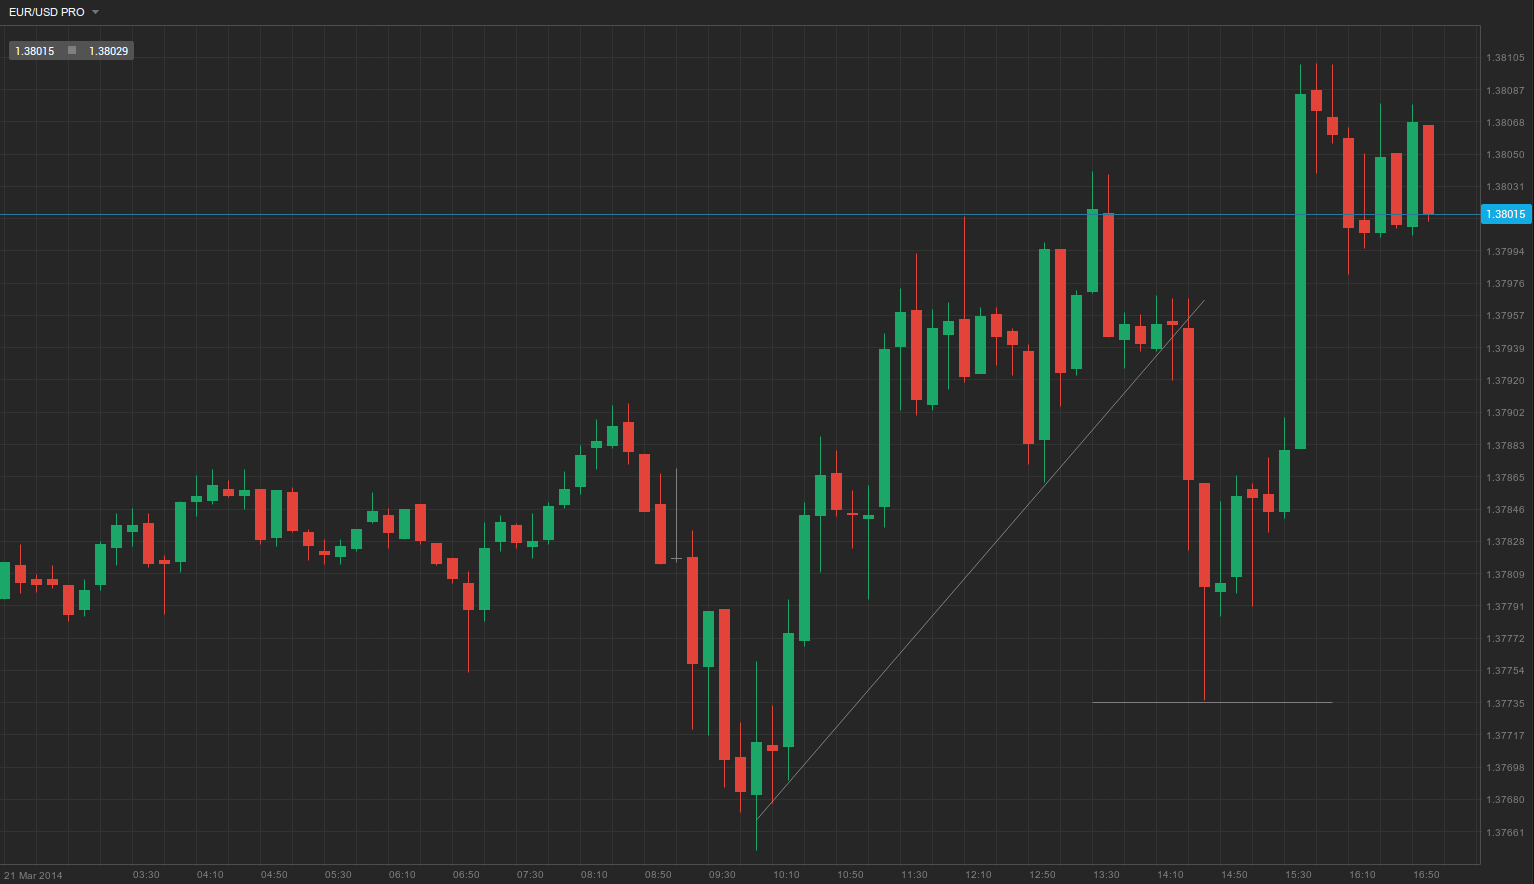
As shown in the example above, the market broke through the trend line with a doji, followed by a large bear trend bar that signalled a possible scalp. As soon as this bear candle closed below the trend line, a short scalp would have been a sensible decision, with a protective stop above the high of the previous bar.