Spike plus channel trends – illustrations part II
This lesson will cover the following
- A case with successive climaxes
- A case with a gap to the upside and a small double-bottom formation
- A case with a spike and a climax
Successive climaxes
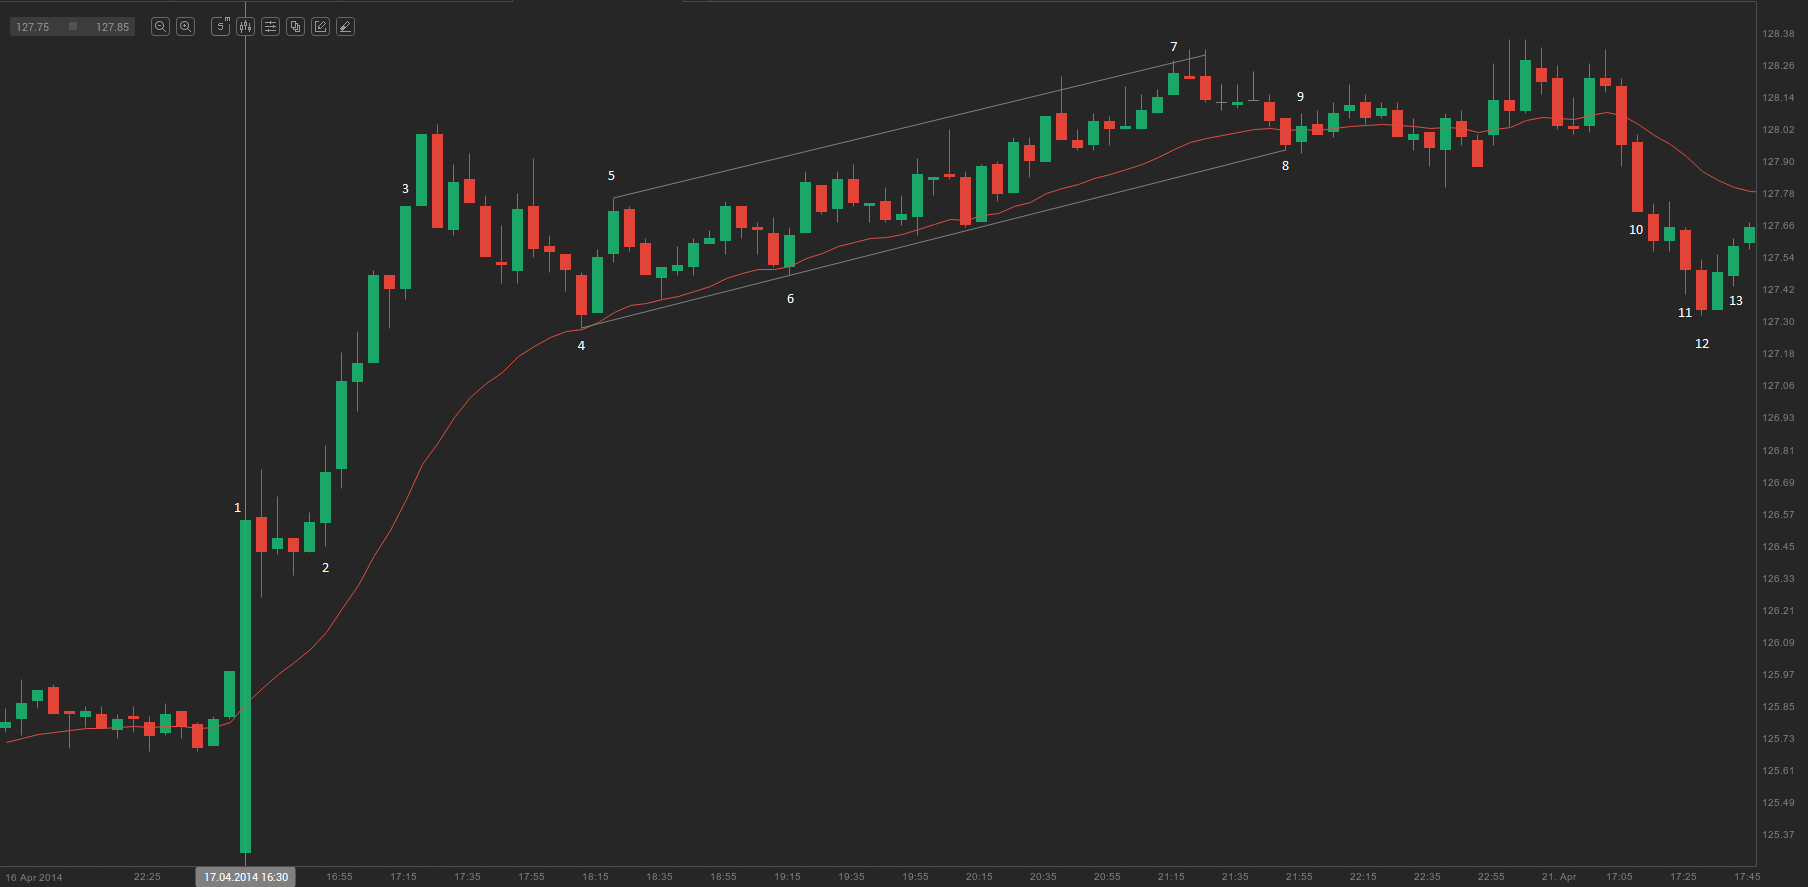
Successive climaxes represent another version of spike plus channel trends. As we have already noted, every large trend bar can be viewed as a breakout, a climax, and a spike. On the 5-minute chart of Boeing Co. (BA) above, bar 1 was a bullish spike that ended with the bar 3 channel. The move up to bar 3 was exceptionally steep, and bars 1 to 3 could be regarded as a single spike (they probably formed one when viewed on higher time frame charts).
Bars 4 to 8 formed a bull channel. Bar 9 broke below the bull trend line. Bars 10 and 11 were successive sell climaxes that finally led to a test of the starting point of the channel (this occurred at the low of bar 12). These climaxes were followed by a pull-back, as the high of bar 13 tested the top of the second climax bar.
A gap to the upside and a small double bottom formation
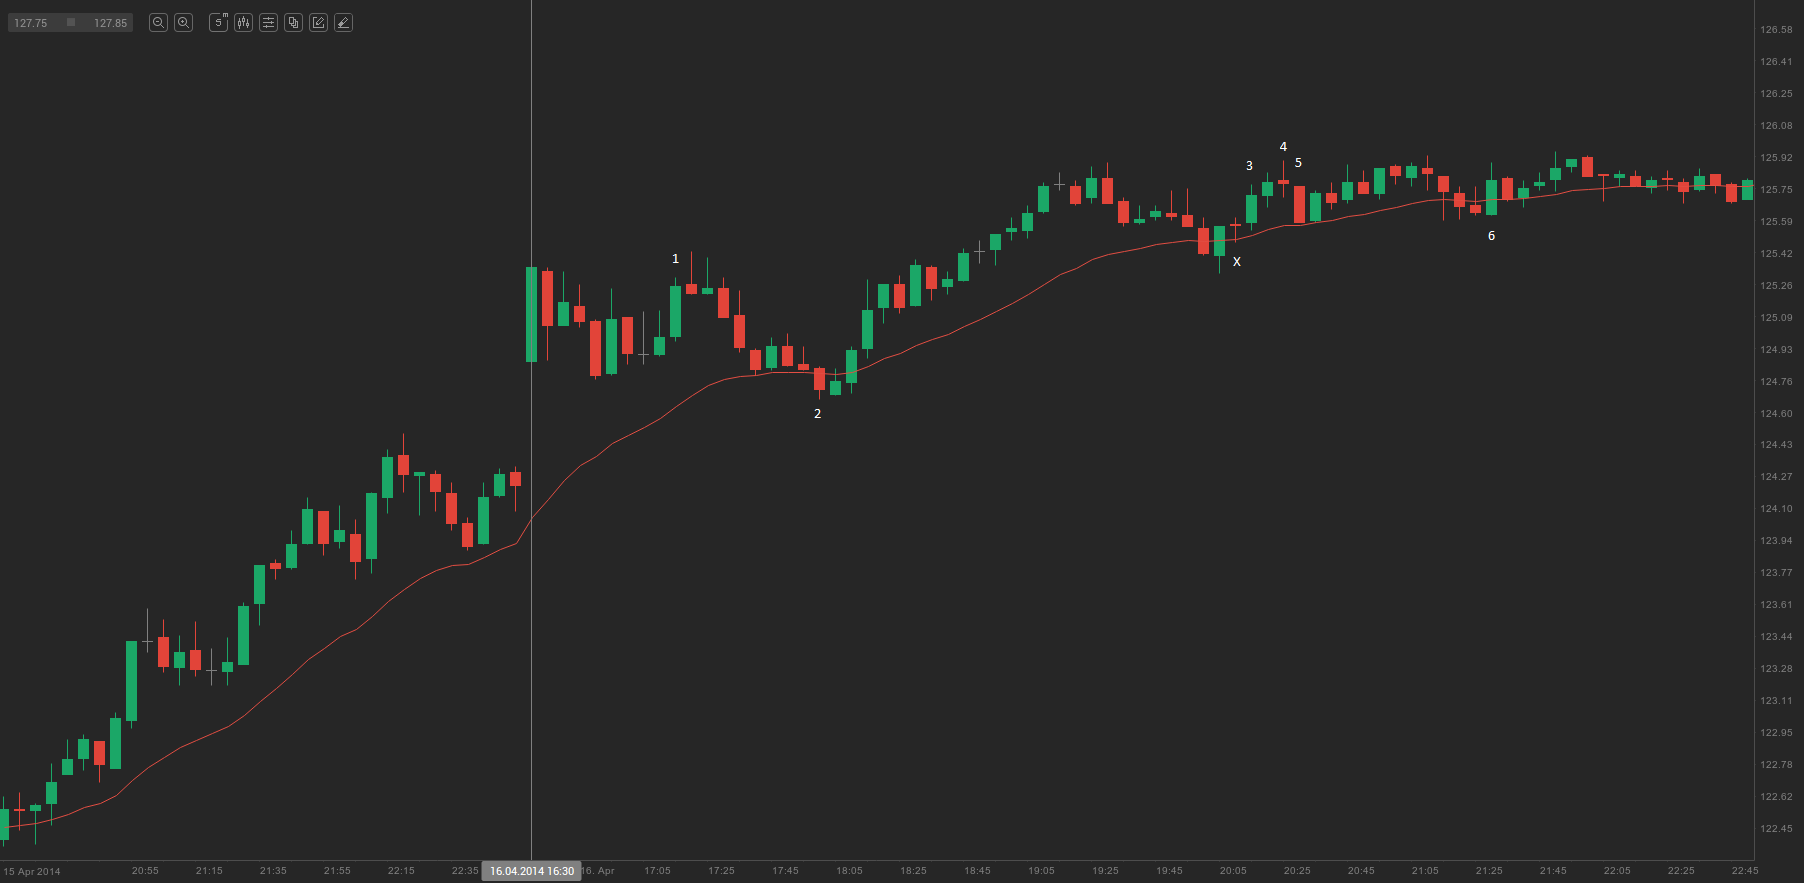
If the market opens with a large gap up, it is usually followed by a two-legged move sideways or down before the uptrend begins. If the opening range – the first five to ten bars – is below 30% of the average daily range, the day is likely to produce a breakout. Traders will look to buy a breakout to the upside and sell a breakout to the downside.
On the 5-minute chart of Boeing Co. (BA) above, bar 1 marked the end of a two-bar bull spike. The market then moved sideways to bar 2. A series of bull trend bars drove the rally to bar 4, after which a bear spike appeared (bar 5). At this point, traders probably wondered whether a trend reversal would occur, because this bear spike was in fact a reversal from a higher high. This bear spike also followed a bull spike (bar 3). When the market produces two strong spikes in opposite directions within a few bars of each other, trading usually becomes sideways, as bulls and bears struggle to establish a channel. Bulls attempt to form a bull channel, while bears attempt to form a bear channel.
- Trade Forex
- Trade Crypto
- Trade Stocks
- Regulation: NFA
- Leverage: Day Margin
- Min Deposit: $100
Within a trading range it is common to see both a bull spike and a bear spike; this is the phase during which the market prepares for a breakout. The small doji bar X led to a two-bar bull spike (bar 3 and the bar that followed it), while the pull-back that could have initiated a bull channel began with the bear spike (bar 5). The market was in a tight trading range, and buyers tried to start their bull channel with the bar 6 bull trend bar. However, it did not materialise and the range continued.
A spike and a climax
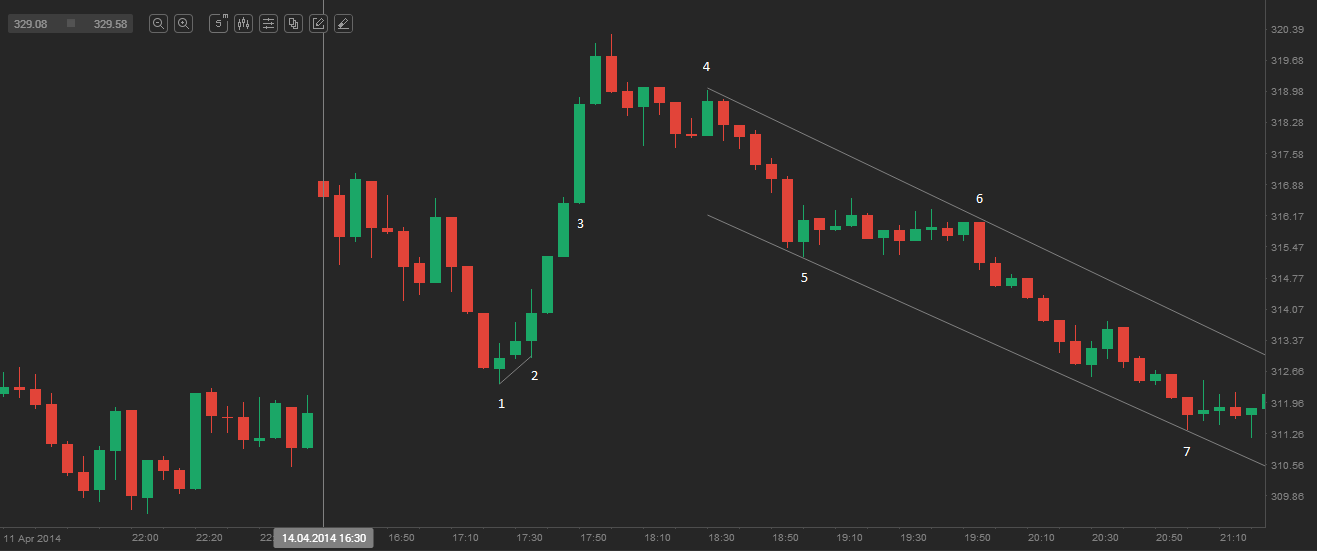
On the 5-minute chart of AMZN above, we are looking at another version of the spike plus channel trend – a spike plus climax – where the spike and the channel are effectively reversed. There was a bull micro-channel from bar 1 to bar 2, while bar 3 was a large bull trend bar. The micro-channel functioned as a bull spike, whereas bar 3 acted as a steep bull channel.