Reversals following ‘spike plus trading range’ formations
This lesson will cover the following
- What are these formations and how should we interpret them?
- How to trade these patterns
When we talk about a climax, we mean a move that has carried the market quite far and quite rapidly, and is then followed by a reversal. Climactic reversals represent huge momentum moves, comprised of several large trend bars, which often breach a trend channel line before reversing. ‘Spike plus trading range’ reversals do not include a strong reversal move through the exponential moving average. Instead, the market reverses direction for 1-2 bars, after which trading becomes sideways and a tight trading range appears. Breakouts from the range can occur in either direction, something a trader needs to be aware of. It is as if the market attempted to reverse but could not quite achieve it. If a trader is examining higher time frames, they would not detect a large reversal bar, but a large bar with a substantial wick that closes around its midpoint.
At times within the trading range, one can spot a counter-trend double top or double bottom flag, which signals an entry against the trend. Conversely, if a with-trend double top or double bottom flag appears, it signals an entry in the direction of the trend.
 What is specific about the reversal move that leads to the trading range is that it is relatively short, especially when compared with the previous trend. Despite this, the move usually breaches the trend line. Some traders may even view it as the initial leg of a trend in the opposite direction. This move may lead to a failed test of the previous trend extreme (a lower high in the case of a peak in an uptrend/a higher low in the case of a bottom in a downtrend), or it may reach a new extreme level and still not become a reversal. If the move is a successful reversal, however, the new, opposite trend can gain strength quite quickly and become a spike plus channel type of trend.
- Trade Forex
- Trade Crypto
- Trade Stocks
- Regulation: NFA
- Leverage: Day Margin
- Min Deposit: $100
There are also cases where a distinct spike appears, followed by a pullback and the beginning of a channel. However, the channel fails to lead to a trend and reverses. Some time later, a trader realises that the pullback was actually the spike in the opposite direction that led to the appearance of the channel. As soon as the spike plus channel pattern is recognised, a trader should look for any suitable entry in the direction of the trend.
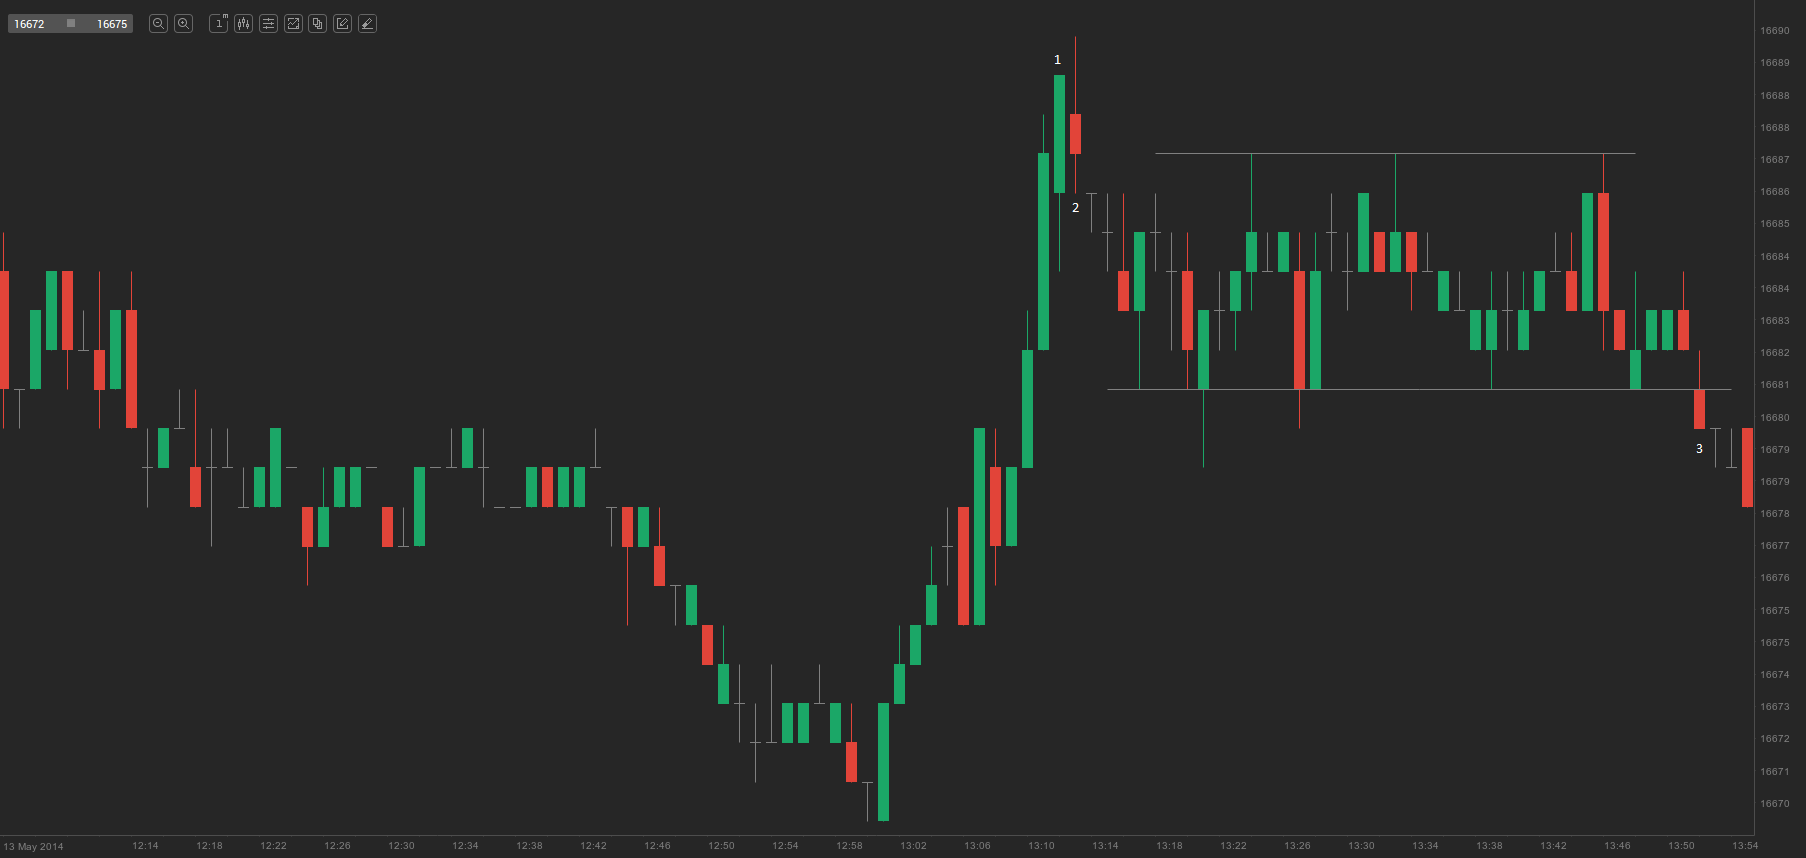
The Dow Jones Industrial Average showed a sharp rise on the 1-minute chart until a bearish reversal bar appeared (bar 2), which was four points tall and can be considered a spike to the downside. The market then entered a trading range for about 30 bars, many of which were dojis. Bar 3 breached the lower boundary of the range and the new downtrend began.
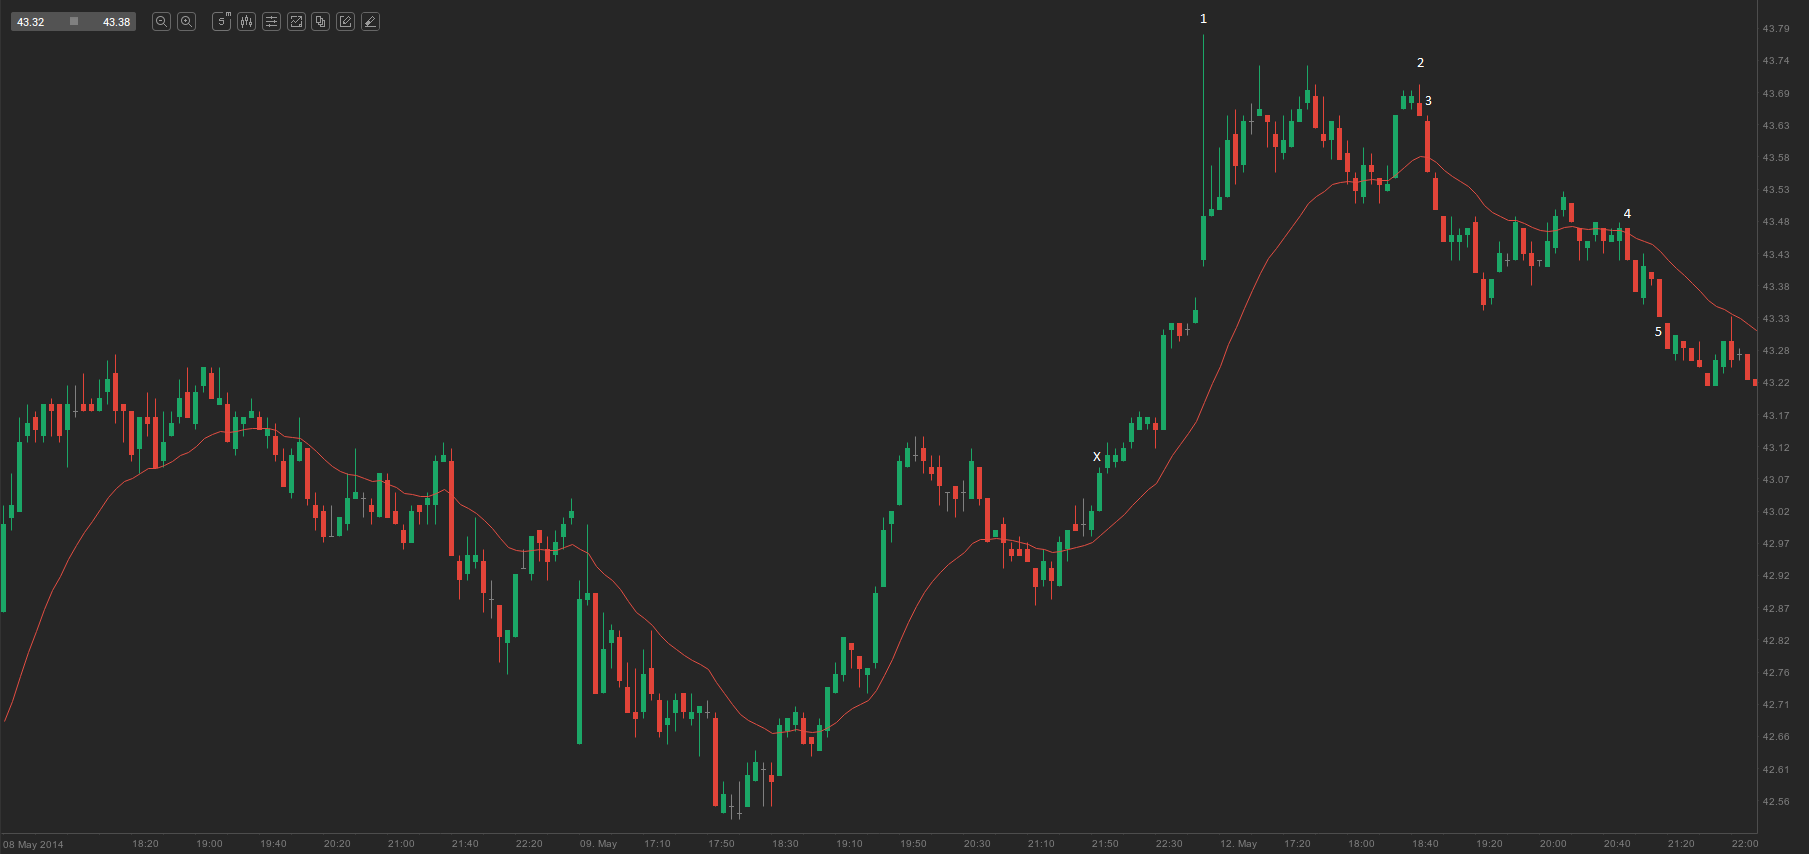
On the 5-minute chart of LBTYA above, bar 1 spiked up and then reversed down, after which the market entered a trading range for about 20 bars and formed a lower high at bar 2. Bar 3 was an EMA Gap bar and a good short set-up. Bar 4 was an M2S set-up, while bar 5 was a bear spike followed by a tight bear micro-channel, which did not manage to test the beginning of the bull micro-channel following the bar X spike during the current trading day. Such a test usually occurs within 1-2 days.