Reversal bars – examples
This lesson will cover the following
- Reversal bars with small bodies and long wicks
- Reversal bars appearing in a trading range
- Other cases
Let us look at a few cases where reversal bars are involved.
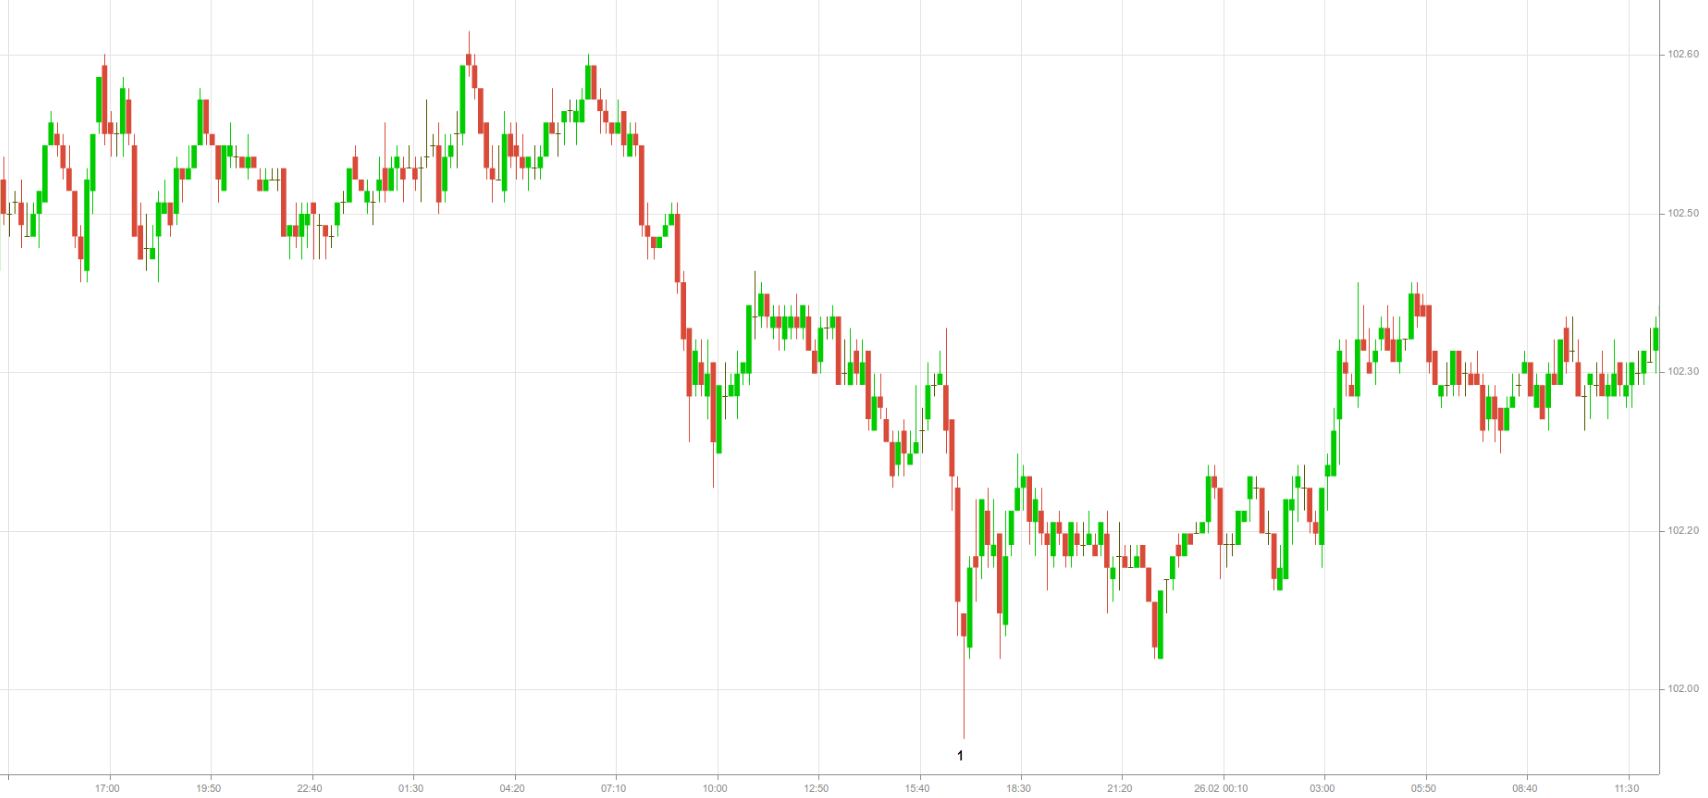
Reversal bars with small bodies and long wicks are usually evaluated in relation to the previous price action. As we can see on the 10-minute chart of USD/JPY above, reversal bar 1 represented a breakout below a previous swing low, while the market was largely oversold. A few large bear trend bars can be seen; they represent successive sell climaxes. Buyers probably waited for the price to test the area below the daily low. Thus, no buying was observed. The absence of buying activity during the several bars leading up to candle 1 caused the market to decline. Buyers probably thought there was no need to enter above the low because they were convinced that a new low would be formed. There was no need to buy now when they could buy lower in a matter of minutes.
We should note that despite the fact that a traditional reversal bar provides one of the most reliable signals, in many cases reversals occur without the appearance of reversal bars. Very often the signal bar is stronger if it is a trend bar in the direction of the trade. In order to buy a reversal at the bottom of a downtrend successfully, a trader needs to look for a signal bar that closes above its open and near its high.
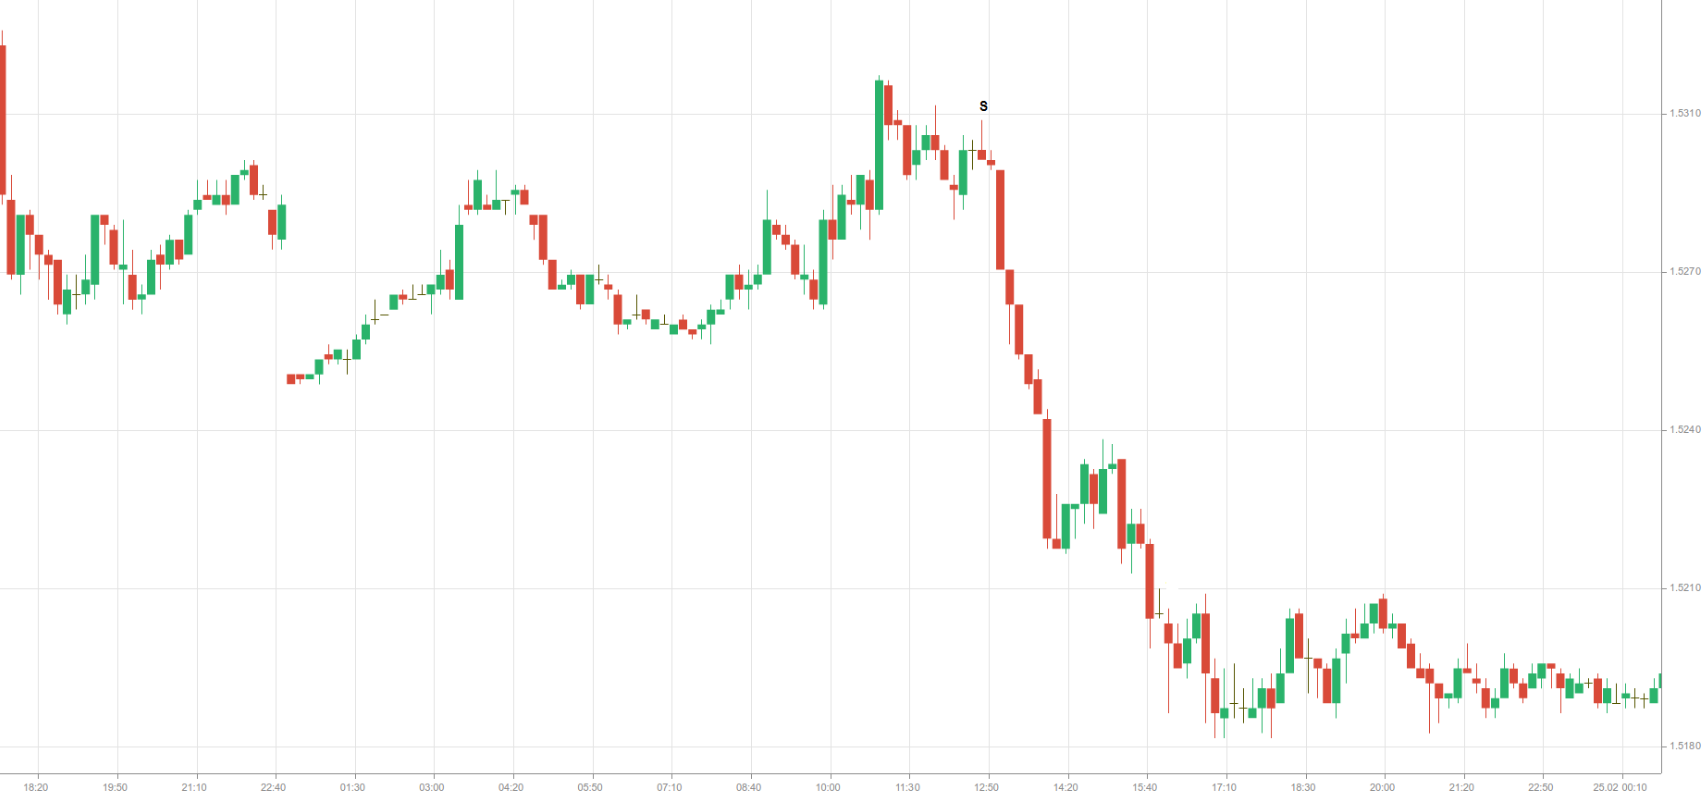
On the 10-minute chart of EUR/CAD we can see a distinct bearish signal bar (S) that appeared in a trading range. There were probably trapped buyers just before the appearance of the doji and the bearish reversal bar; when they were forced to close their positions, the selling pressure from traders who were already short increased. More experienced traders expected that sellers were stronger than buyers below the low of the bar marked (S), so they went short there. They expected enough selling to follow so that they could scalp a profit.
Usually when prices are in a trading range during a downswing, a bear flag forms. In the case of a strong pattern, traders will need to buy close to the low and sell close to the high.
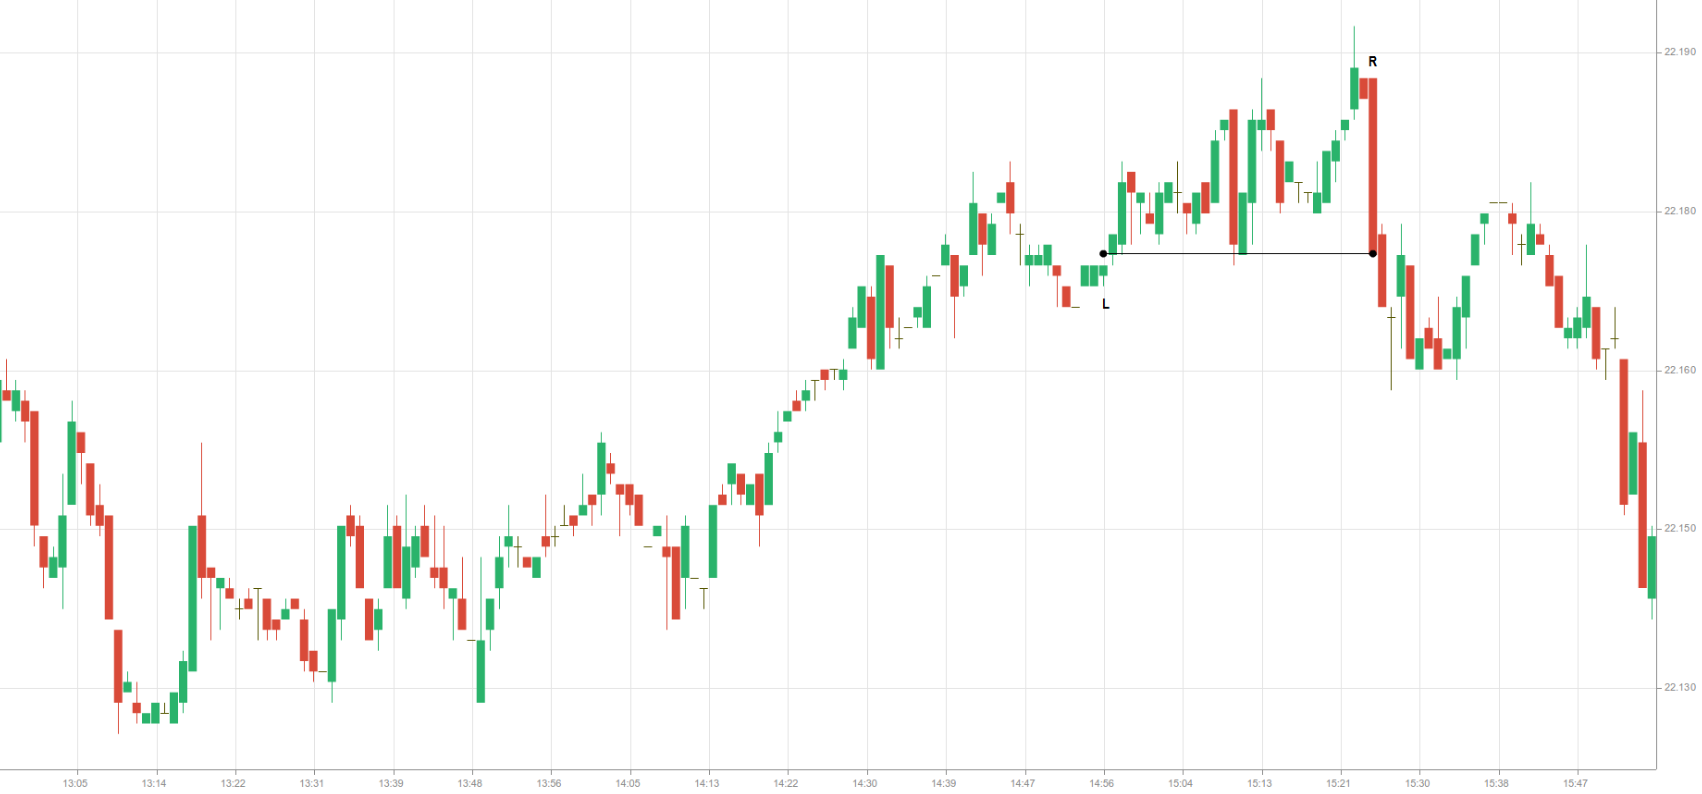
Sometimes bearish reversal bars may have a high that does not exceed the high of the previous bar or bars, but still lead to a reversal in the market’s direction. On the 1-minute chart of GBP/MXN above we can see a large bear trend bar marked (R) that appeared in an uptrend, with its body reversing price direction. Its closing price reversed the closes of the previous 28 bars and the lows of the previous 13 bars, which suggested strength. Traders who went long on the close of the bar marked (L) and also during the formation of the next 28 bars would now be holding losing positions. If these traders did not exit while the large bear trend bar was forming, they would probably have closed at its close or after the following bar traded below its low.
 Bulls with the greatest strength usually keep their positions when pullbacks occur and will probably keep them until they are convinced that the trend has flipped. Such a strong reversal bar, like the one marked R, has the potential to change the price direction. Such a bar could also prompt strong buyers to think that prices will probably fall far enough for them to close their long trades and immediately go long again at much lower levels (sometimes at a distance based on the height of the large bear trend bar).
- Trade Forex
- Trade Crypto
- Trade Stocks
- Regulation: NFA
- Leverage: Day Margin
- Min Deposit: $100
These traders will embrace any chance to close their long trades. Although they expect to exit the market at a loss at this point, they would like to see as small a loss as possible. They may place limit orders above the closing price of the bar marked R or even above the high of the previous bars.
If no pullback occurs that would enable trapped buyers to exit with a smaller loss within the next several bars, these traders will likely exit at the closing prices of bars with bearish closes.
 Buyers who continued to hold their positions through the close of the bar marked R are known as swing bulls. They can afford to hold positions through a pullback. They are usually the strongest players in the market, as the majority are corporate entities with formidable financial capacity; thus they are able to tolerate pullbacks.
If these participants decide that prices will continue to decline, and as there will be no more large buyers, the market may indeed slide for a number of bars until a support level is reached, where these players eventually consider going long once again. However, if a strong buy setup does not appear, they will not buy but will continue to wait.
The bar marked R was probably regarded as a signal bar, so many market participants likely went short below its low. This bar was probably also an entry bar; therefore, other traders likely went short during it as it moved below the low of the preceding bar and extended downwards. This was probably because they thought the breakout above the trading range of the past 28 bars was losing strength. Therefore, the bar in question can also be considered a breakout bar, as it breached that trading range to the downside.