Other types of signal bars and patterns
This lesson will cover the following
- What are inside bars
- Inside-inside pattern
- Exhaustion bars
- Wickless bars
- Micro double top and bottom patterns
In the previous articles of our price action guide, we’ve underscored the reversal bar as one of the most reliable signal bars, followed by double-candle reversal patterns and their variations, such as triple- and four-candle reversals. Other types of bars that could generate an entry signal are candles with small ranges, exhaustion candles, and micro double top and bottom formations.
Small candles are essentially those with a smaller range compared with the previous candle, and they indicate a lack of enthusiasm by both bulls and bears. An example of these is the inside candle. It has a low above the low of the previous candle and a high that matches, or is beneath, the high of the previous one. It can also have a low at or above the low of the previous candle and a high below the preceding one’s high. Small candles are most reliable if they are counter-trend and less reliable if they are large dojis, as these usually precede sideways trading. To learn more about doji candles, check out our Doji article.
After a big trend candle breaks out of a trading range, the appearance of an inside candle can mean two things – it may simply be a pause by trend-following traders, or it could represent a loss of conviction that ends with a reversal, thus rendering the breakout failed. The chance of a reversal improves if the inside candle is a trend candle in the opposite direction. There are a couple of things a trader needs to consider when that happens.
 If, for example, we have an upward breakout during a downward trend, traders usually place a buy order above the inside bar and a sell order below it. The execution of one order makes the other the protective stop. If prices fall and the sell order is filled, the trader should double the size of their buy stop order in case the failed breakout becomes a breakout pullback. However, if the long order is filled, the trader should not reverse on their protective stop.
During a strong trend, small candles can also be used for trend-following entries. In a strong uptrend, for example, a bullish inside candle close to the high of a large bullish trend candle is a good long-entry signal. However, if we have a small candle that extends above the bullish trend candle’s high, it can be treated as a long setup, but only if the trend is strong enough.
Inside-inside pattern
 Another category of small candles that can act as reversal signals includes the inside-inside and inside-outside-inside patterns. The inside-inside pattern consists of consecutive inside candles where the second is engulfed by the first, which itself is an inside candle. The inside-inside formation is always a clear reversal on a smaller time frame. You can see one on the following screenshot.
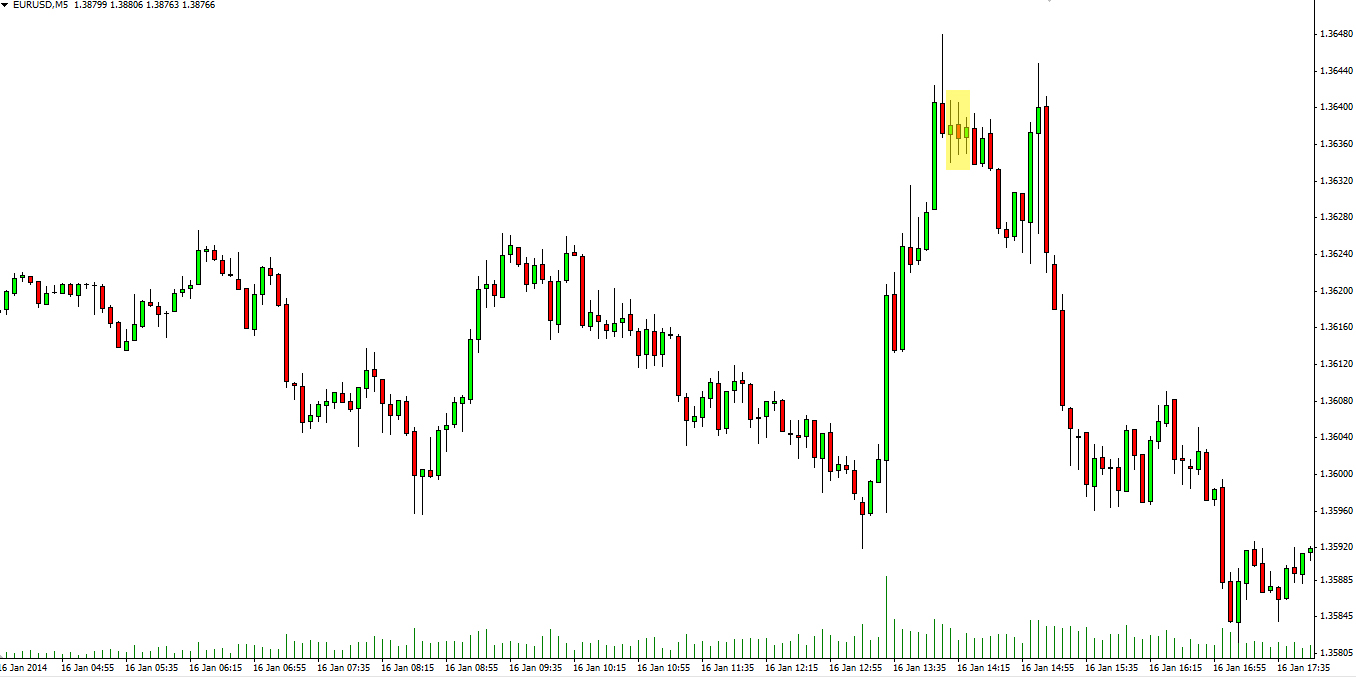
It is a breakout setup that can become a flag or a reversal formation. A variation of the inside-inside pattern, regarded as a bit more reliable, is the inside-inside-inside pattern, which comprises three consecutive inside bars.
- Trade Forex
- Trade Crypto
- Trade Stocks
- Regulation: NFA
- Leverage: Day Margin
- Min Deposit: $100
Usually, a trend-following breakout from an inside-inside pattern is followed by a short movement, often just a scalp, and is likely to reverse. Conversely, a breakout against the trend often leads to a larger reversal. The protective stops in an inside-inside pattern are placed beyond the opposite ends of both bars that make up the pattern.
You can also encounter the so-called inside-outside-inside formation, which, as you can guess, is made up of an inside candle, followed by an outside candle and another inside candle. Because it is often a breakout setup, traders relying on this pattern should enter on the breakout above or below the second inside bar, with the opposite end being the right spot to place a protective stop.
Micro double top and bottom
 Another potential trend reversal might be indicated by the formation of a micro double top or micro double bottom. These consist of consecutive, or almost consecutive, bars with matching or nearly identical lows or highs, respectively.
The micro double top formation can produce a trend-following signal when it forms in a bull spike and consists of a bull trend candle closing at or near its high, followed by a bear trend candle opening at or near its high. This is a single-candle bull flag. If the highs are identical, you should buy a couple of pips above the high; if they are not, it is likely a reversal pattern.
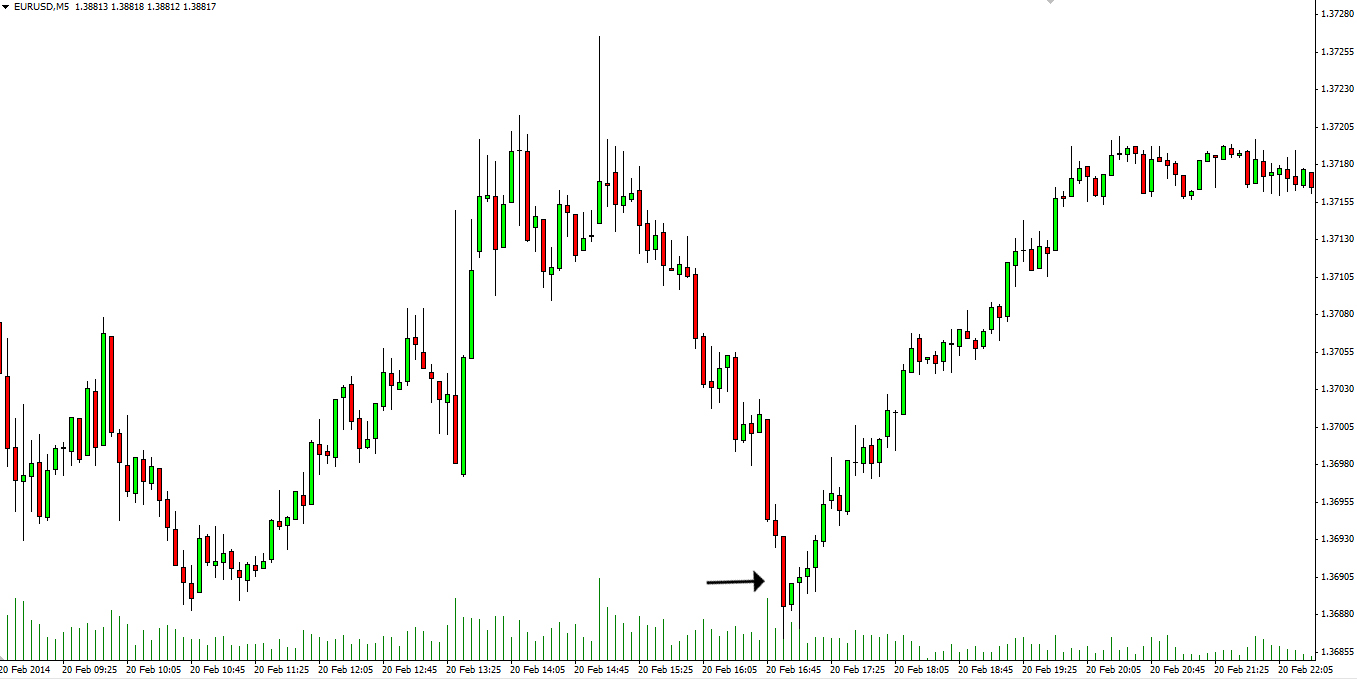
Logically, a micro double bottom is the opposite. It forms during a bear spike and comprises two candles: a bearish trend candle that closes at or near its low, followed by a bullish trend candle opening at or near its low, thus forming a single-candle bear flag. Interpretation is identical to that of the micro double top, just in the opposite direction. You can see a micro double bottom visualised on the following screenshot.
Exhaustion bars
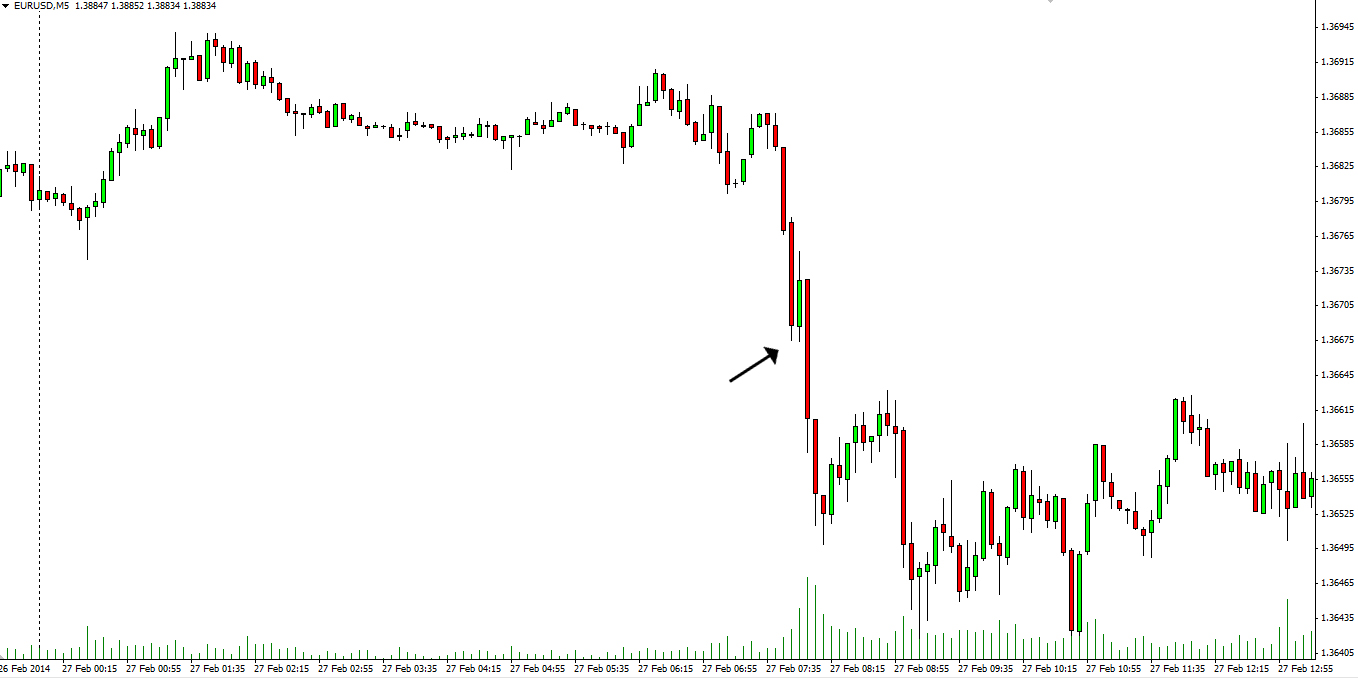
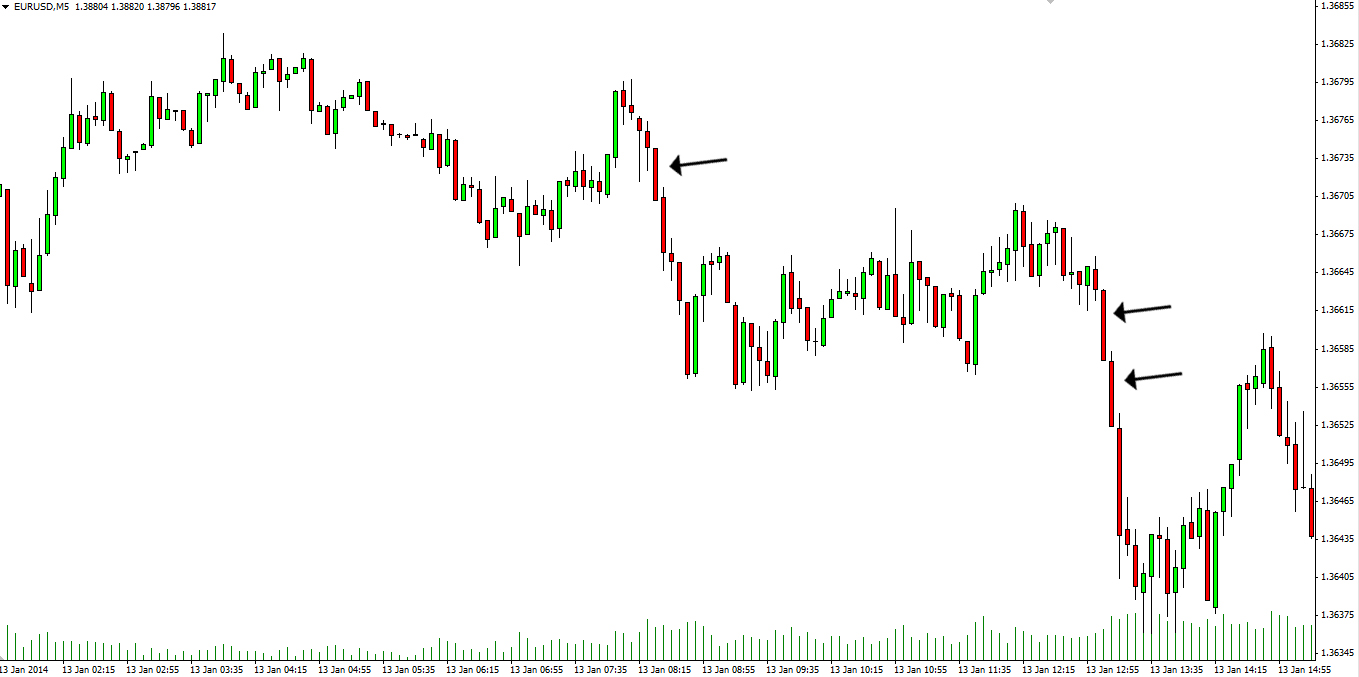
 We’ve already mentioned in the article ‘Price action spectrum. Trend candles’ that, although trend candles usually generate signals for trend-following entries, they can sometimes precede reversals. An extraordinarily large trend candle in the trend’s direction can sometimes reflect emotional exhaustion among the controlling bulls or bears. This is basically a buy/sell climax. Check out the following screenshot.
The climactic, exhaustion nature of unusually large trend candles represents a situation in which the last buyers or sellers in the market are buying or selling in panic because they feel they must enter at any price. At the same time, those positioned in the opposite direction want to get out at any price to avoid further losses. If no other buyers or sellers support the initial movement, the market will eventually reverse. Unusually large candles signify exhaustion, especially when the market has trended in a single direction for at least 10 bars and is expected to reverse or correct for at least 10 bars.
Keep in mind, and we’ve mentioned this before, that first breakout attempts most often fail, trapping traders who believe the move will be strong enough. This is observed very often on quiet days when the market is trading sideways and the price is bouncing up and down between the boundaries of the range, trapping market players who expect a breakout to occur.
Wickless candles
 A candle that lacks wicks (or shadows) at one or both of its extremes generates reliable trend-following signals, but only during a strong trend. When a trend candle in the direction of a strong trend has no shadows, or, as some call them, is ‘shaved’, it indicates that either the bulls or the bears are in almost full control and the market is in a strong trend.
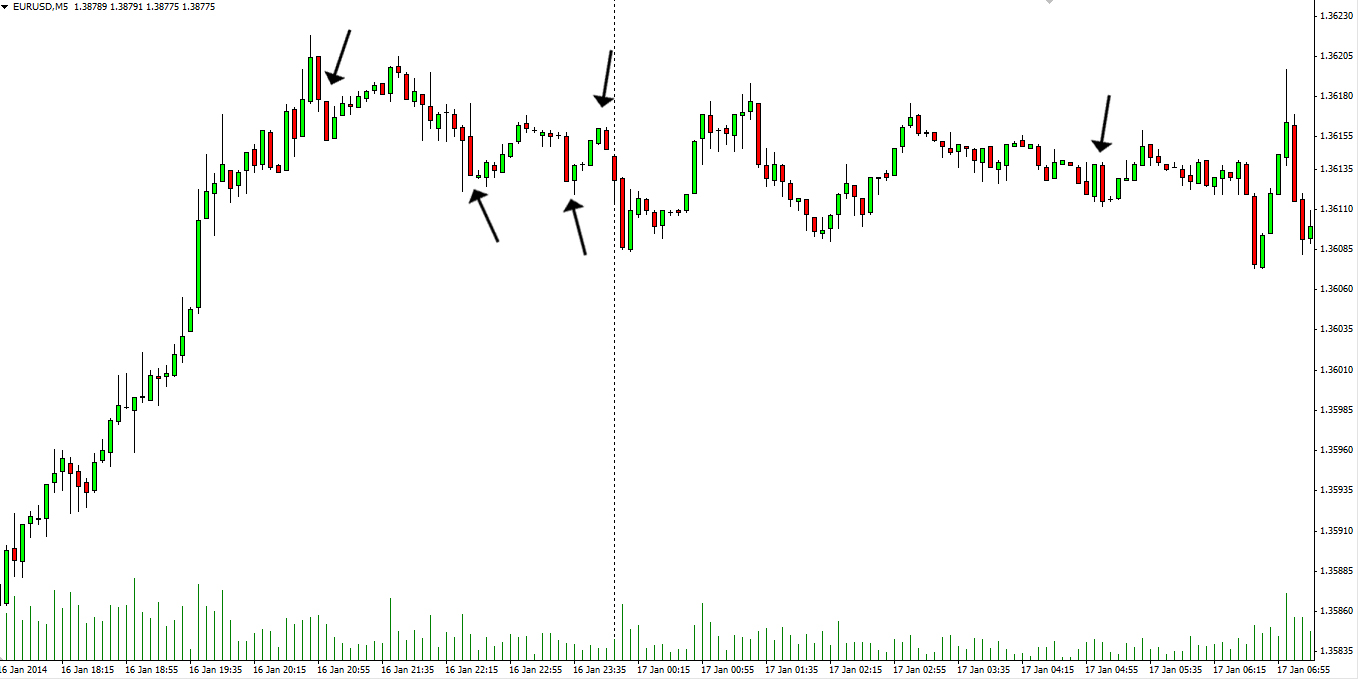
A perfect shaved candle has no shadows at all, indicating that the bulls or bears have pushed the price from bottom to top, or vice versa, without opposition. If there is a wick beyond one of the extremes, the signal is stronger if the extreme strength occurs right into the close. For example, if we have a strong bullish candle within a bull trend, it is preferable if the top is shaved, and not the bottom, because that provides more definitive proof that the upward movement will continue and we can enter a long position above its high. Logically, the opposite scenario – go short below a shaved bottom of a bearish candle in a strong bearish trend – is also valid. You can see several of those in the following example.
If our bullish trend candle, however, has a small shadow above its close and a shaved bottom, it is still a display of strength, but it should not be the sole basis for a long entry. The same applies to the opposite market direction.
You should keep in mind that shaved candles are reliable signal generators only during strong trends, because trading ranges tend to test extremes repeatedly and the chance of a rebound off support and resistance zones is greater than that of an actual breakout. When volume is low, wickless candles occur frequently and, logically, don’t indicate any strength. You should avoid betting on them if you see too many on your chart.