Micro trend lines – scenarios
This lesson will cover the following
- Micro trend lines in strong trends
- Micro trend line tests
- Failed breakouts from micro trend lines
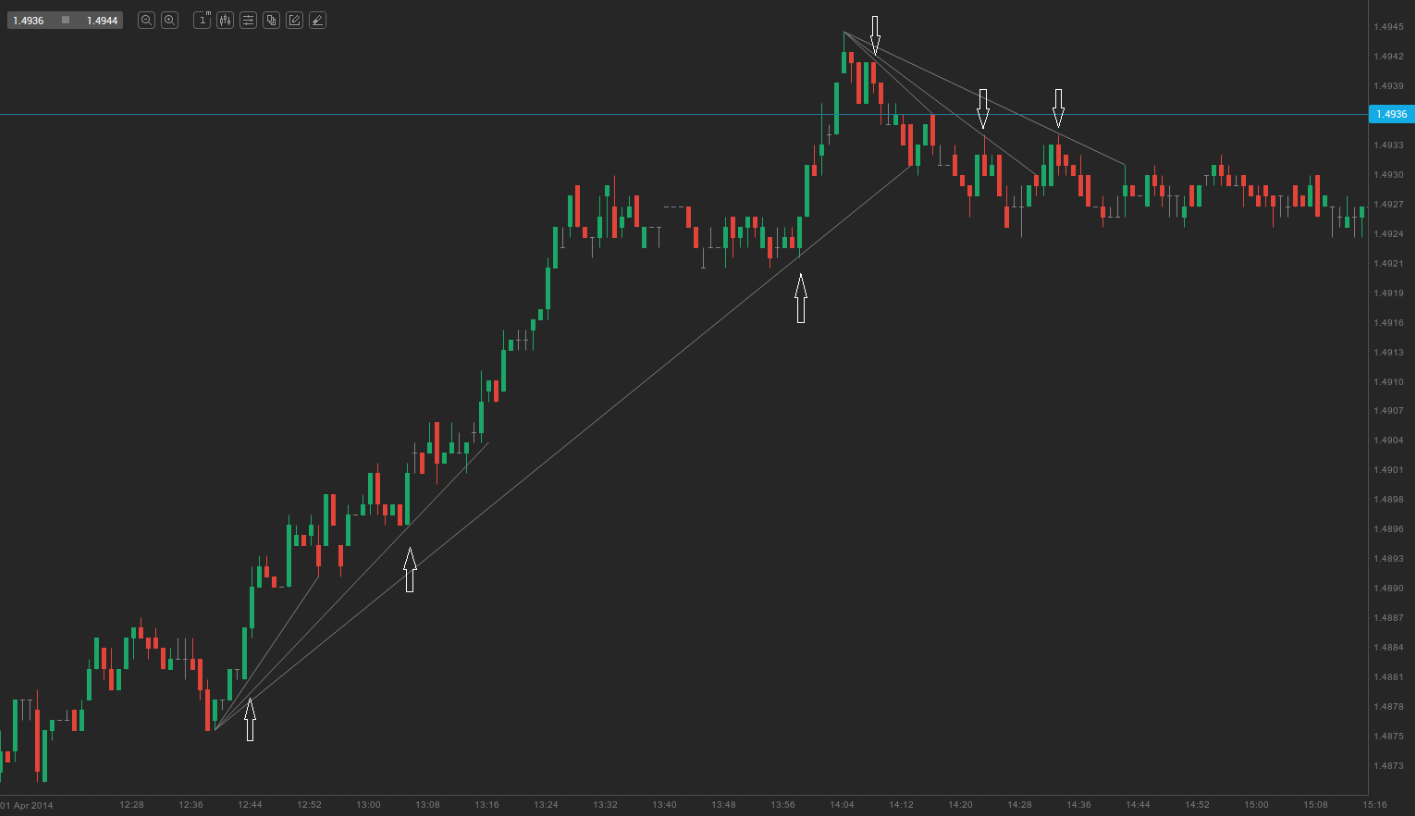
Micro trend lines
On the chart above we can see a few failed breakouts from micro trend lines, which could have been profitable trades.
Micro trend lines in an uptrend
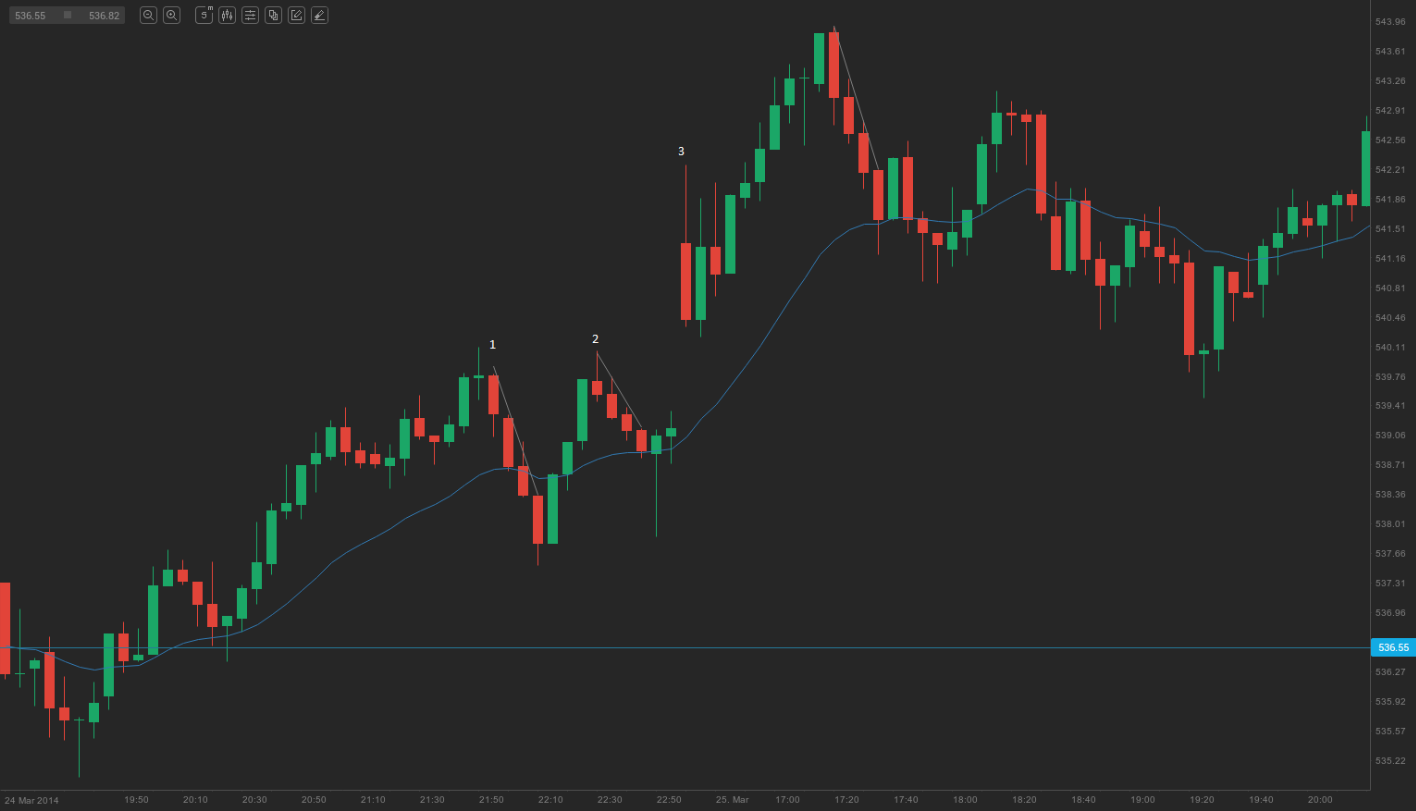
If we are in a resilient uptrend, short positions are not appropriate. This is also true for shorting micro trend lines close to or above an Exponential Moving Average (EMA). Going short on bars 1, 2 and 3 on the chart above would have meant entering against the underlying uptrend while close to the EMA. Although those micro trend lines sloped downwards (signalling micro downtrends), each one of them actually represented a pullback in the major uptrend. Therefore, a long entry on each pullback would have been a better decision. These micro trend lines were also bull flags and occurred above the EMA (with the exception of one). This further supported the strength of the upward movement.
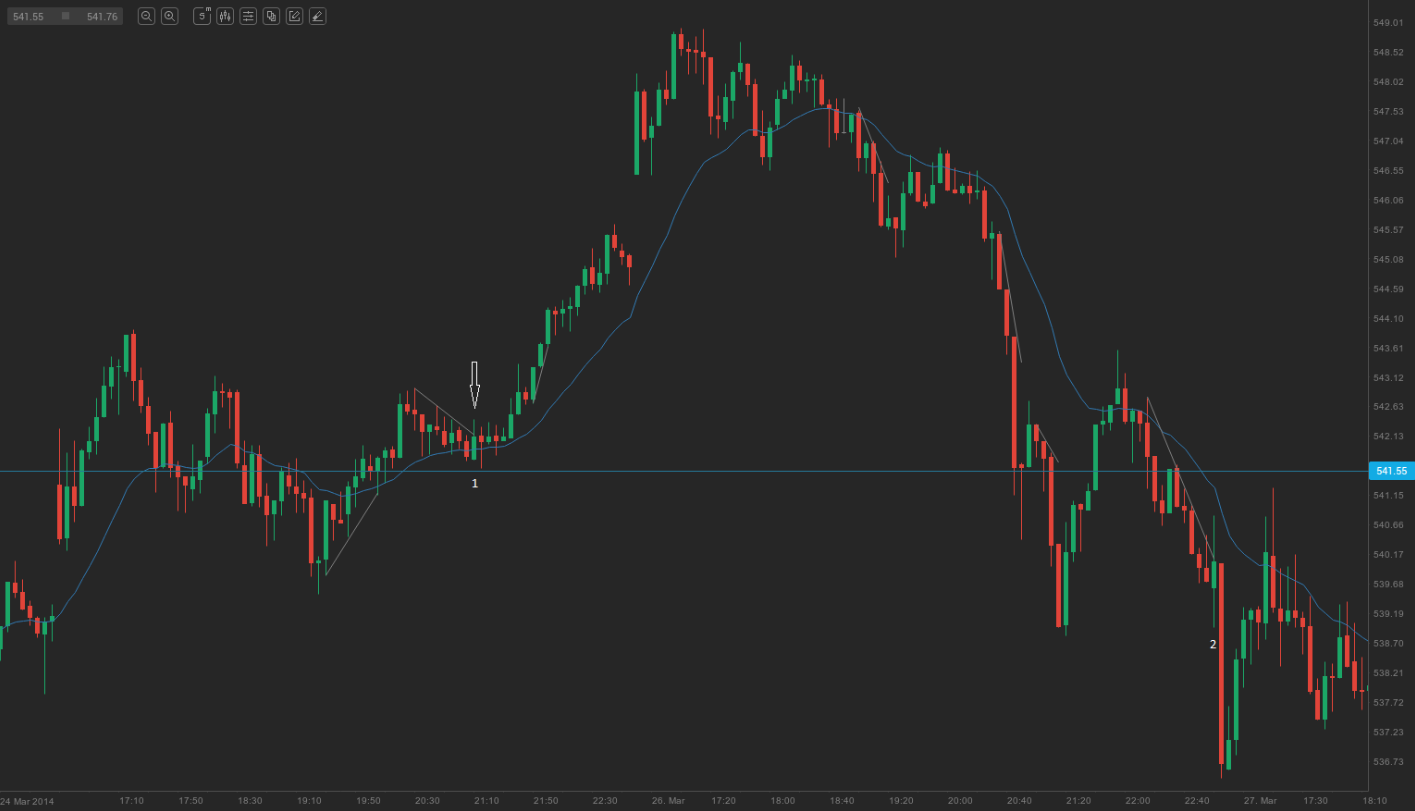
Micro trend line tests
A micro trend line on a 5-minute chart is usually a three- to ten-bar pullback on the 1-minute chart. During the trading session, the 1-minute chart of EUR/AUD provided entry signals on trend line tests and reversals. It may appear easy when examining the chart at the end of the session, but it is far more complicated to make money trading this chart in real time. The best setups may appear poor, but they form quite rapidly, giving a trader little time to act, while the worst setups provide a trader with plenty of time to enter. Trading on the smallest time frame will cause a trader to take many losing trades and not enough profitable ones to neutralise those losses, so at the end of the day the overall result would probably be a loss.
On the chart above, each consecutive trend line becomes shallower until trend lines in the opposite direction take hold of the price action.
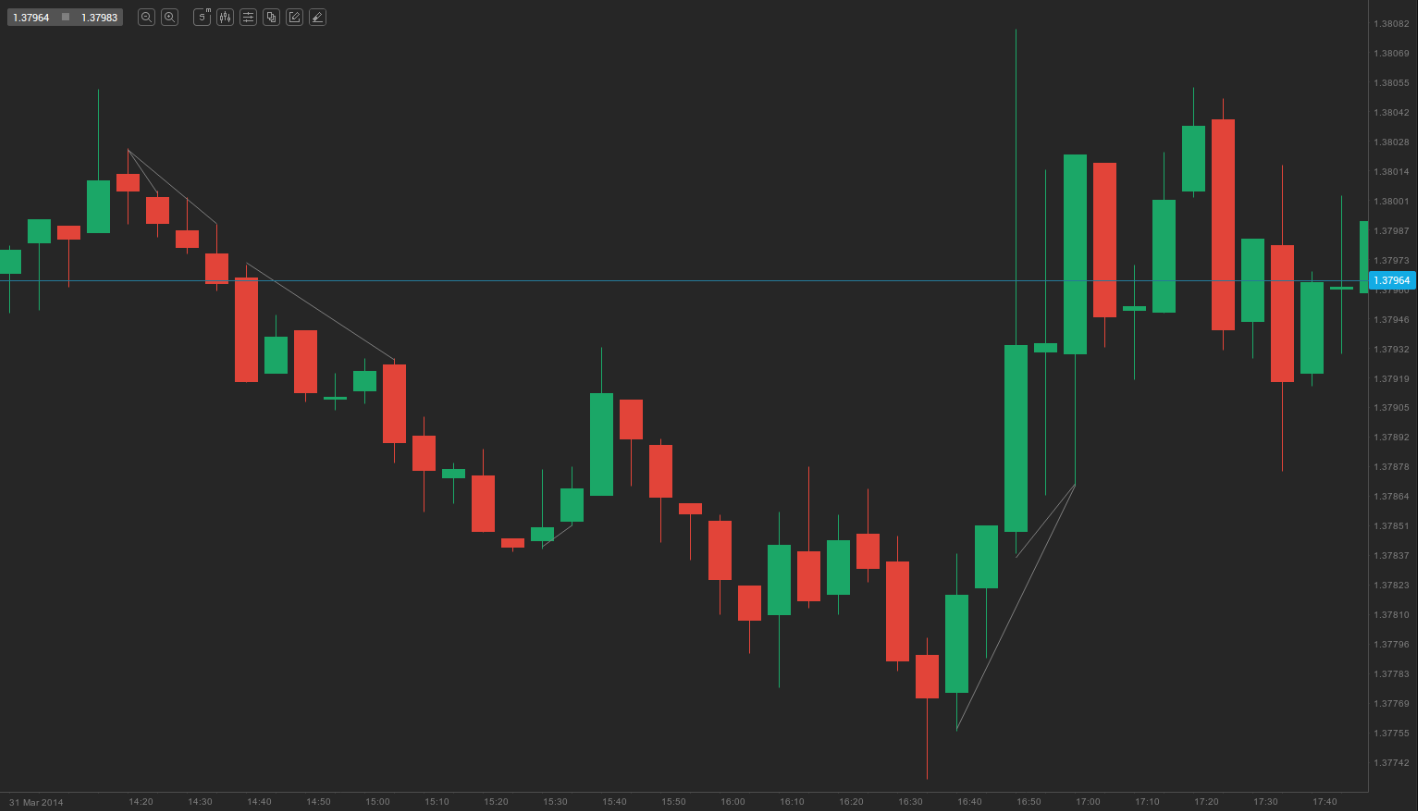
Micro trend lines in a strong trend
Micro trend lines in strong trends, often even when drawn across adjacent bars, may have failed breakouts, which provide a trader with the opportunity to enter in the direction of the trend. If viewed on a 1-minute chart, they may appear as two-legged pullback setups, but there is no need to do that. It is enough to detect failed breakouts on the 5-minute chart.
- Trade Forex
- Trade Crypto
- Trade Stocks
- Regulation: NFA
- Leverage: Day Margin
- Min Deposit: $100
On the 5-minute chart of AAPL above there were a number of good opportunities to enter in the direction of the trend (failed breakouts from micro trend lines). Usually, if we are in a steep trend, the best decision is to avoid trading small reversals and trade only with the trend. Bar 1 breached a bear micro trend line, but this small downtrend was nothing more than a bull flag, occurring in an uptrend, where prices had been above the EMA for 14 bars. Thus, a trader would have been looking only to go long, not to short (especially above the EMA). Bar 2 was a breakout above a steep, tight bear channel and was not an appropriate long entry.
Failed breakouts from micro trend lines
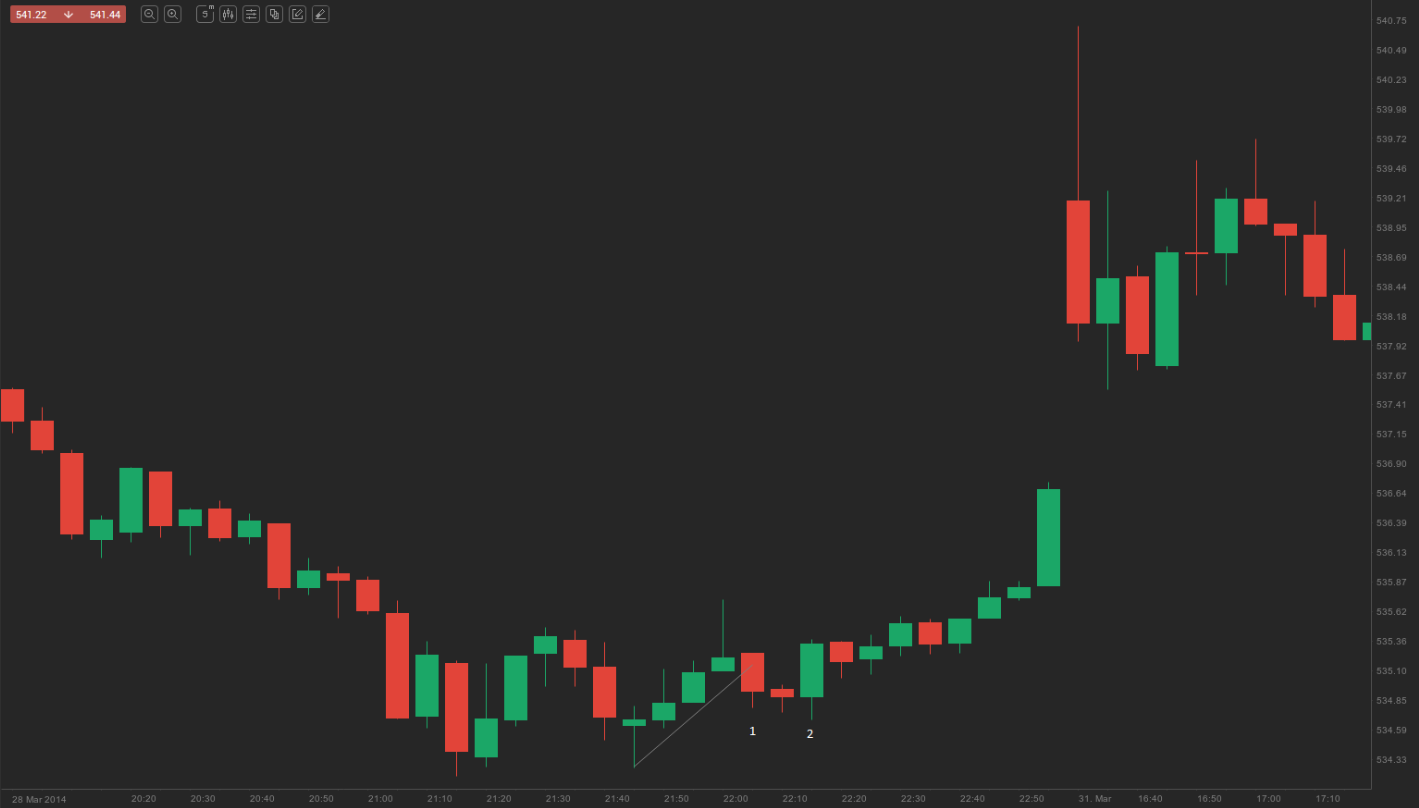
On the 5-minute AAPL chart above, there is another failed breakout from a micro trend line. Bar 1 plunged below a five-bar micro trend line. In this case, a trader would have placed a stop order to buy above its high and, if not filled, would move the stop to the high of the following bar. The order would have been filled on bar 2.
Beginners should note that the majority of breakouts to the downside from bull micro channels in an uptrend usually fail.