Further talk on failed patterns
This lesson covers the following
- Failed final flags consisting of tight trading ranges
- Failed final flags consisting of large trend bars
- Failed trend resumptions after pullbacks – failed High/Low 2 setups
Very often, you will see long trends form a trading range in their late phase – frequently a flag several bars wide – which accelerates in the direction of the trend towards a new extreme and then reverses, often transitioning into a trend reversal. This type of market behaviour is called a Failed Final Flag and usually precedes the end of a trend.
The pattern can also consist of only one or two very large bars instead of a longer trading range, but the outcome is the same. In most cases, it is followed by a two-legged counter-trend setup, which can last for more than an hour and is tradable. Although it is a counter-trend correction, the subsequent move does not necessarily – and, more importantly, reliably – lead to a trend reversal, so further confirmation is required.
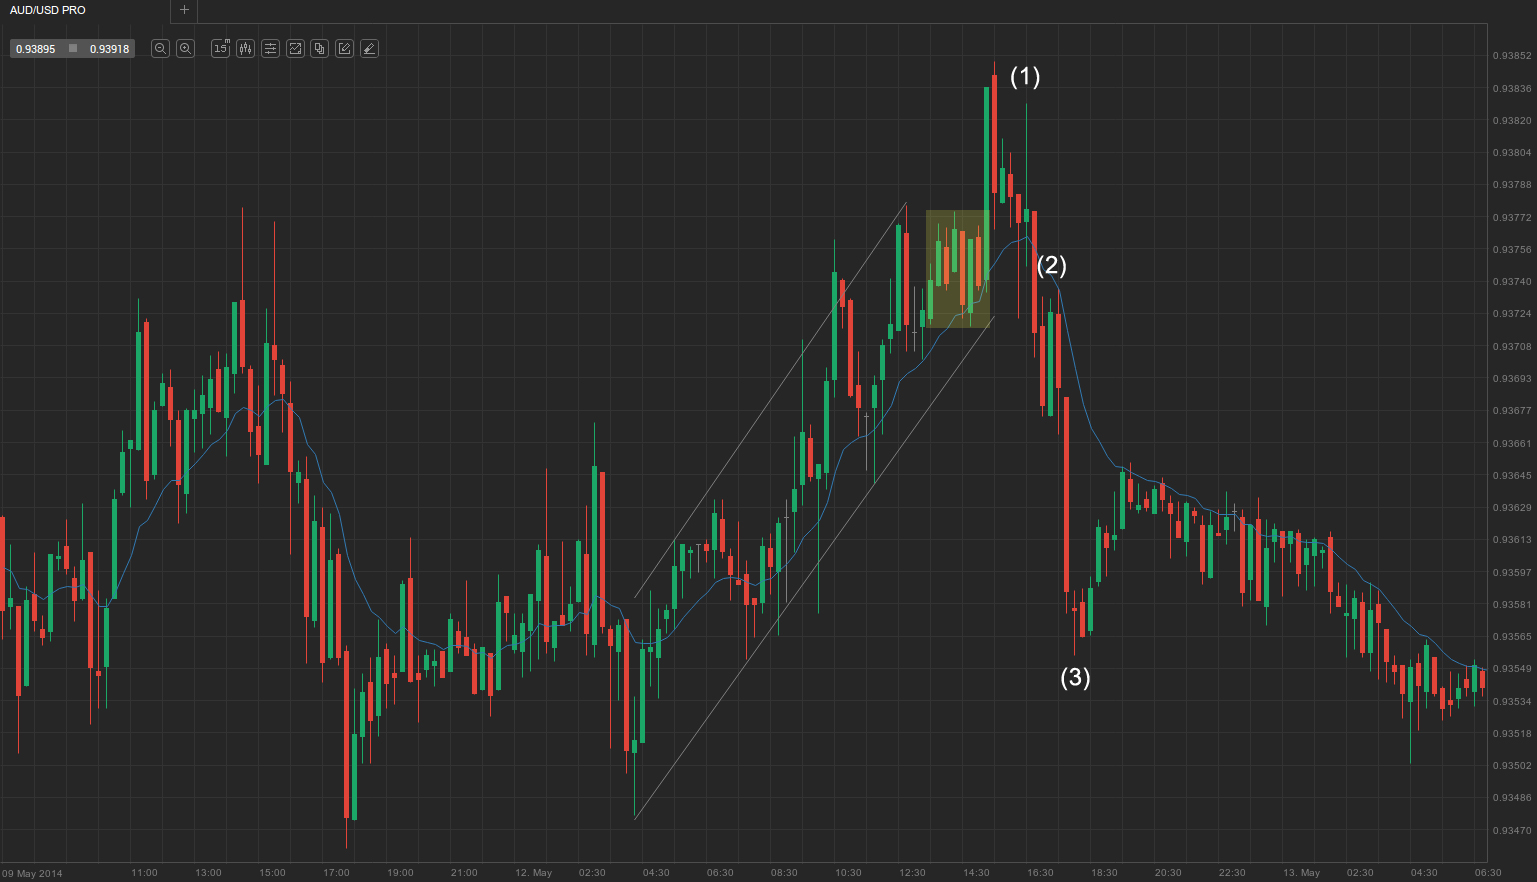
The market formed a trading range in the late phase of a strong trend that had continued for more than ten hours. The trend channel line was broken twice, which, however, did not lead to a faster-than-expected acceleration of the trend, whose momentum remained contained within the channel. The first signs of trend exhaustion appeared when the market entered a seven-bar trading range, indicating that bears were ready to make a stand and that this could be a failed final flag. The price broke out of the trading range with a huge top-shaved bull trend bar – a buy climax – because many bulls saw the breakout as a sign of trend continuation. However, as most of them considered the newly hit day’s high a suitable point to lock in profits, and smart shorts entered, anticipating that trapped longs would fuel the move, the market reversed.
The counter-trend move that follows failed final flags is usually at least two-legged. Bulls attempted to regain control, as evidenced by the big doji bar at (1). However, bar (1) was probably still part of the first leg rather than its end, which continued up to bar (2), and was followed by the second leg down to bar (3).
Occasionally, the reversal after a failed final flag merely causes the pattern to grow into a larger wedge-shaped flag. In a bullish trend, for example, the first leg of the wedge is the failed final flag, the second leg is the bar that reversed the market, and the remaining bars of the wedge are the sell-off after the reversal. Once the wedge has formed, it can either become a larger failed final flag and be followed by a reversal, or act as a continuation pattern (a larger bull flag).
Large trend bars
 As mentioned earlier, in some cases a failed final flag can comprise one or two large trend bars instead of a trading range lasting several bars. This scenario can be observed during strong trends, which move quickly and feature large trend bars. As with the previous variety, the price breaks out of the small flag – often undershooting or overshooting the trend’s extreme – and then reverses with a two-legged counter-trend move.
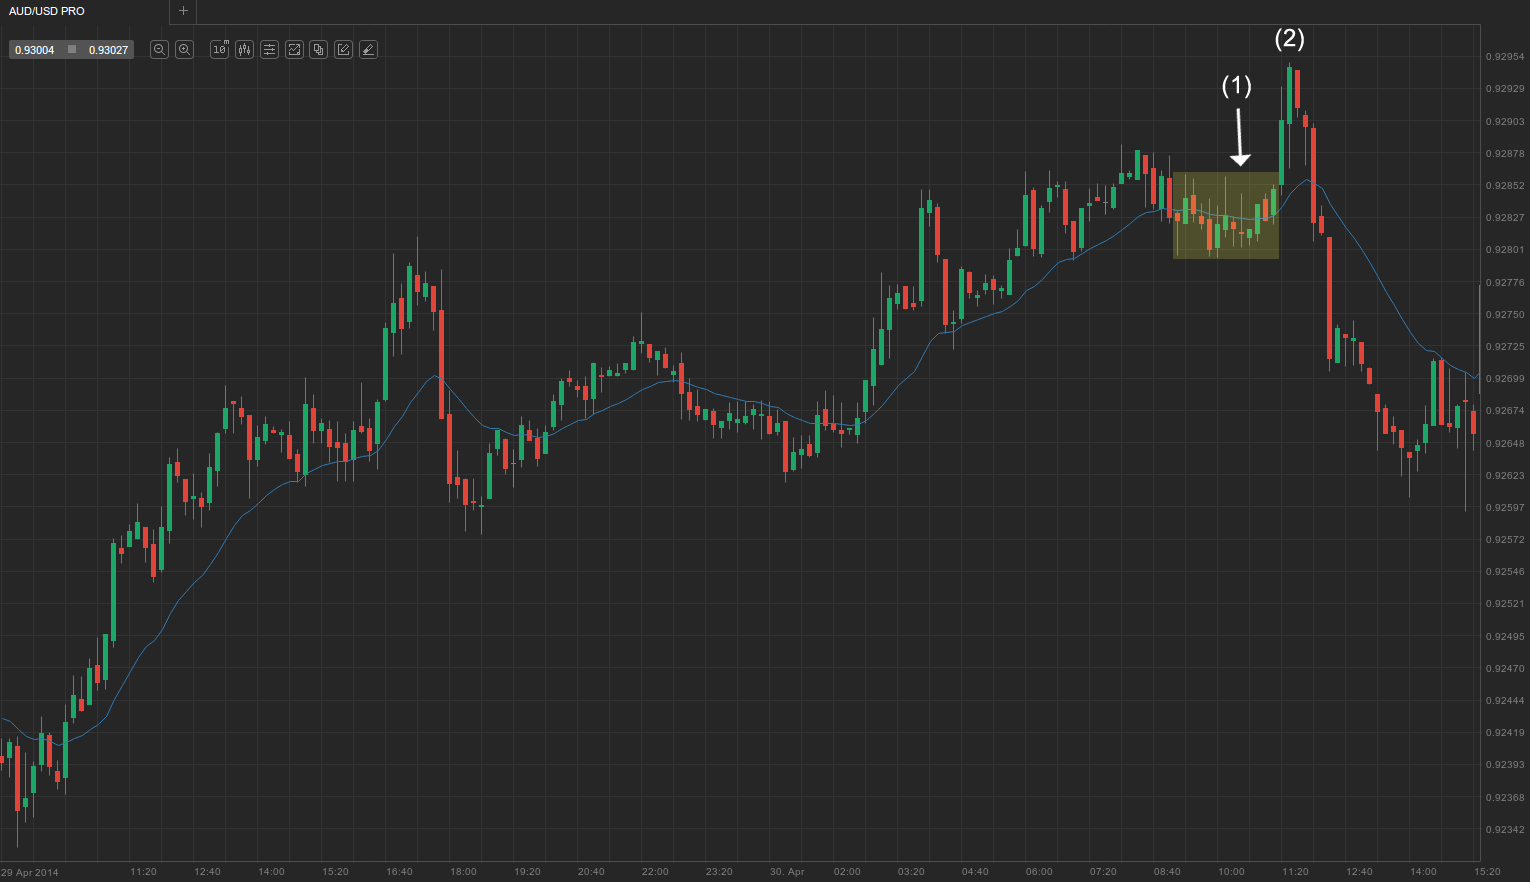
As you can see in the screenshot above, the market was in a very strong and protracted bullish trend for almost a full day and formed a ‘barbed wire’ trading range in its late phase, alerting astute traders to be cautious with further with-trend entries. The price broke out of the trading range, accelerating past the recently hit trend extreme and marking a new session high. The strong breakout from the trading range was a two-legged move, with the first leg ending at bar (1) and the second at bar (2). Two-legged moves out of flags often set up major reversals.
This effectively became a failed final flag and was expected to be followed by at least a two-legged move down. The first leg comprised five bear trend bars, the last of which was effectively a sell climax, paused by a short rally and followed by another drop to a swing low that ended with consolidation in a trading range.
Failed trend resumptions after pullbacks

We’ve already discussed in the articles ‘Counting Bars in Order to Detect End of Corrections’ and ‘Pullbacks in a Strong Trend – One of the Most Profitable Trades’ that the High 2 and Low 2 setups are among the best-performing with-trend setups. This is because they basically mark the end of two-legged pullbacks (during a pullback in a bull trend, for example, the High 1 is the first bar whose high extends above the previous bar’s high – effectively the end of the first leg; High 2 is the second bar during the downward move whose high is above the previous bar’s high, thus signifying the end of the second leg, and, as we know, the market usually makes two-legged movements).
However, this pattern occasionally fails and the correction usually extends for two more legs, up to High 4 or, respectively, Low 4. If the price then again fails to rebound, there is a very good chance that the pullback has actually become a new trend. That said, traders must proceed with caution: if a High/Low 2 setup fails and the correction extends for two additional legs, they should still avoid adopting a counter-trend position until a major trend line is broken. If the High/Low 4 setup also fails and the price accelerates through a major trend line, it is highly likely that the market has reversed into a new trend and traders should switch to the opposite positioning.
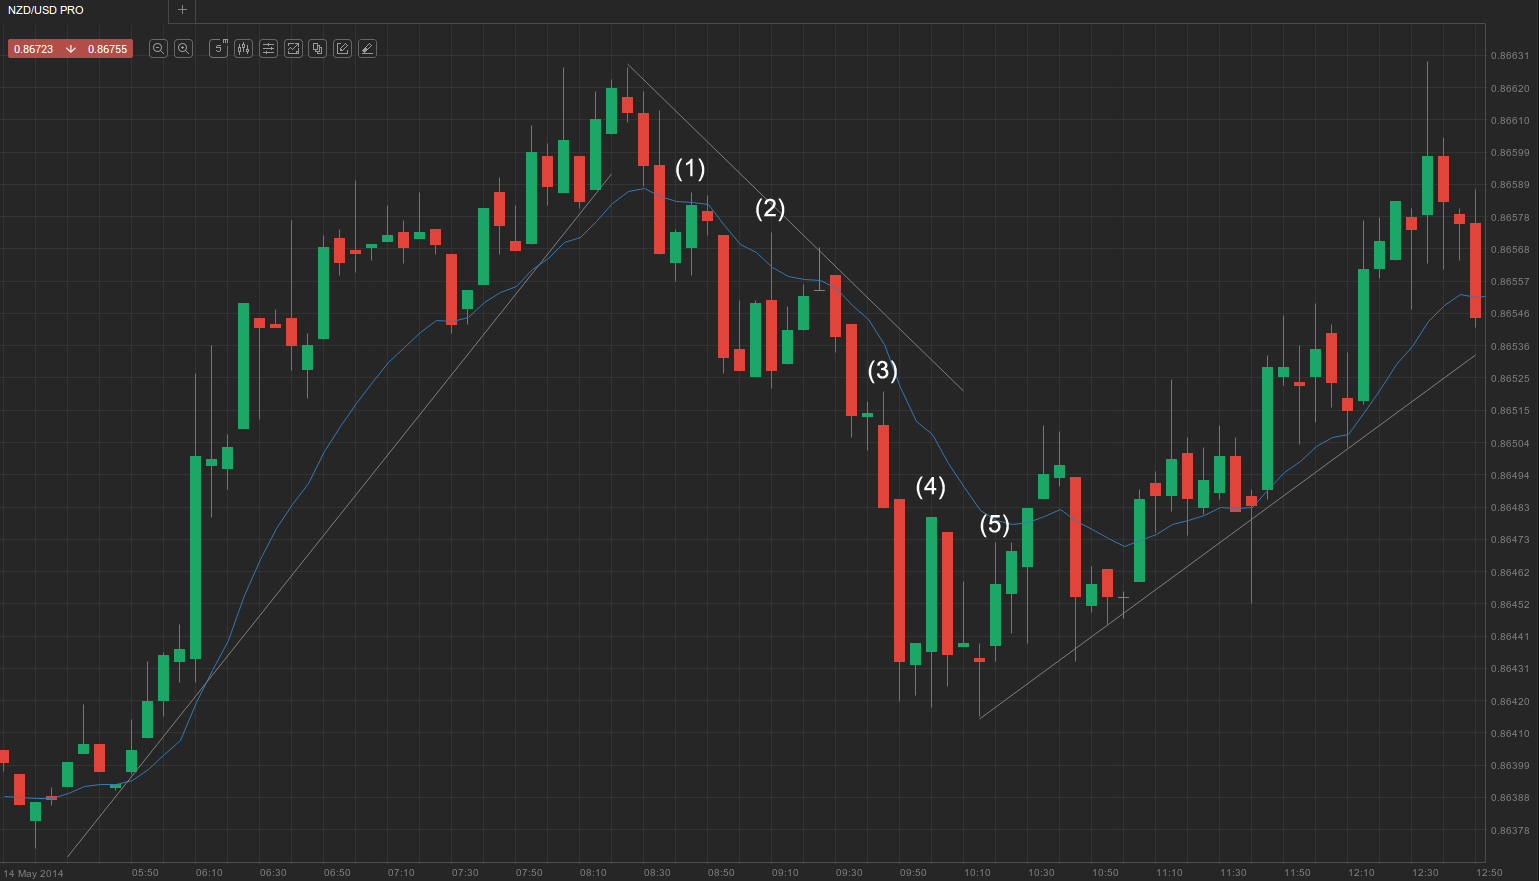
In the screenshot above, you can see a failed High 2 visualised. A very strong bullish trend that had not pulled back to the 14-day EMA eventually overshot it, and a typical acceleration towards a new trend extreme followed. The market then pulled back and broke the major trend line. You can see that the High 2 was reached during a with-trend bar, which carries a higher chance of failure for the pattern and continuation of counter-trend movement. The prior bar was a strong, almost double-shaved bull trend bar, and as the High 2 bar opened at its close, there was insufficient buying pressure to sustain a close above the moving average. The market entered a small trading range resembling ‘barbed wire’, and a downward breakout followed, thus rendering the High 2 setup a failure. High 3 and High 4 followed, and although the pullback did not end with High 4 but rather High 5, it can still be deemed overall successful.