Channels and breakouts in terms of price action – examples
This lesson will cover the following
- Channels may exist within a larger channel
- Breakouts from channels may fail
- Channels may appear in both bull and bear trends
Channels within a larger channel
Within a larger channel, it is possible to spot several smaller channels, as shown on the chart below.
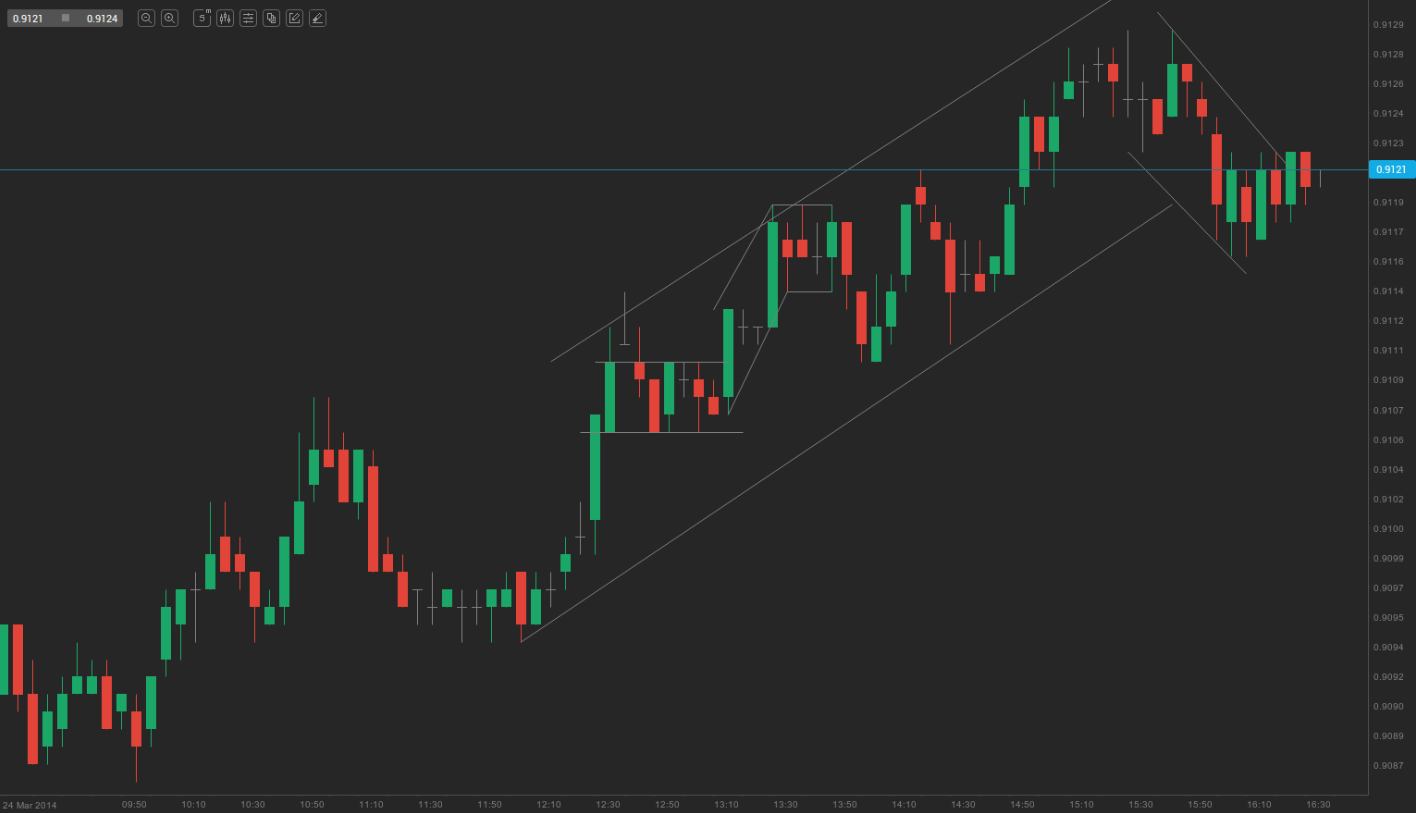
Most of the channels here appeared to be tight. As they had no pullbacks, or only small one-bar pullbacks, and lasted for fewer than ten bars, they can also be considered micro channels. We shall discuss them in our next article.
Failed breakouts from channels
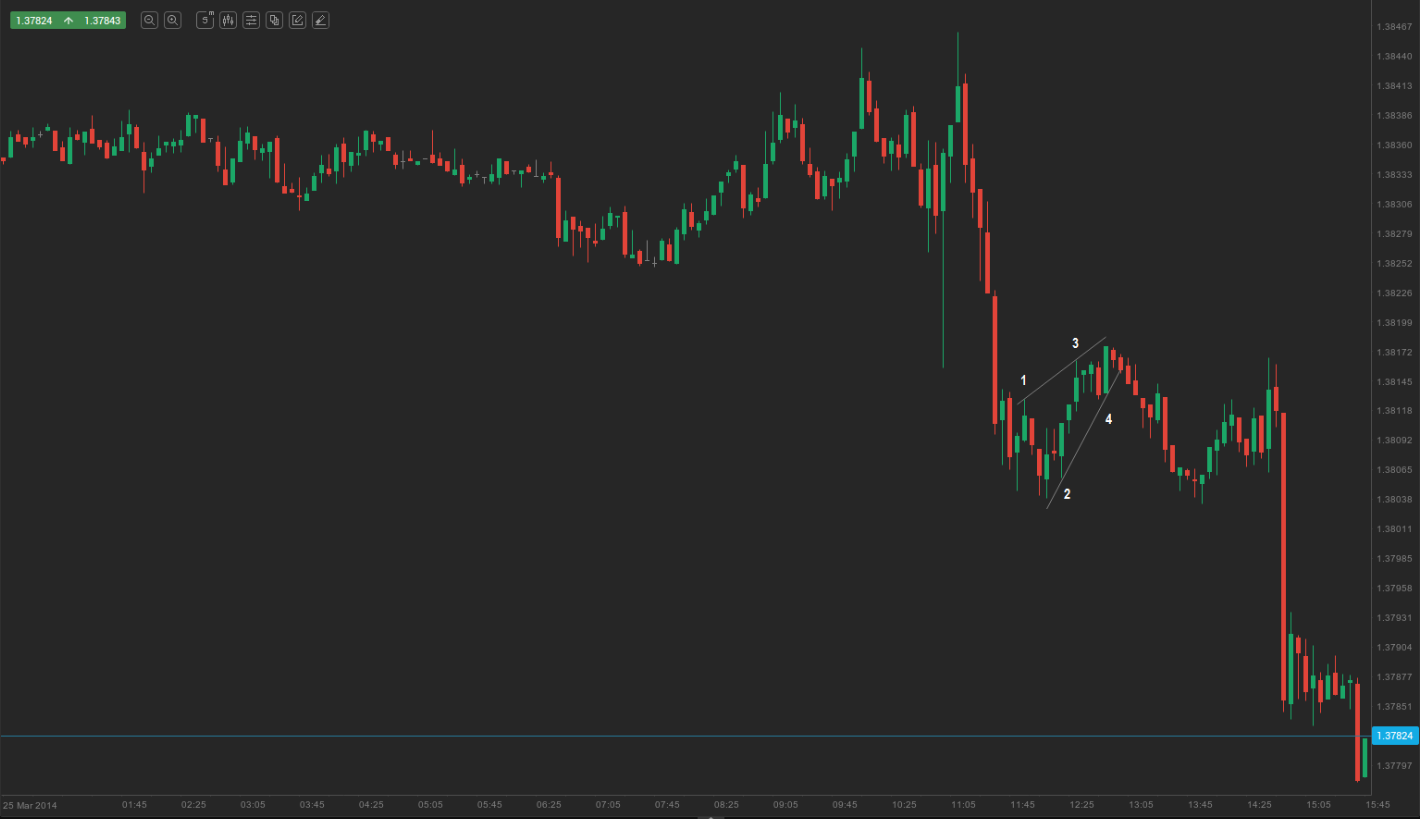
If prices break out of a channel and then return inside it, a test of the opposite side of the channel may be expected. Moreover, prices often break out through the opposite side. If this breakout is of considerable magnitude, the first target may be at least a measured move equal to the height of the channel.
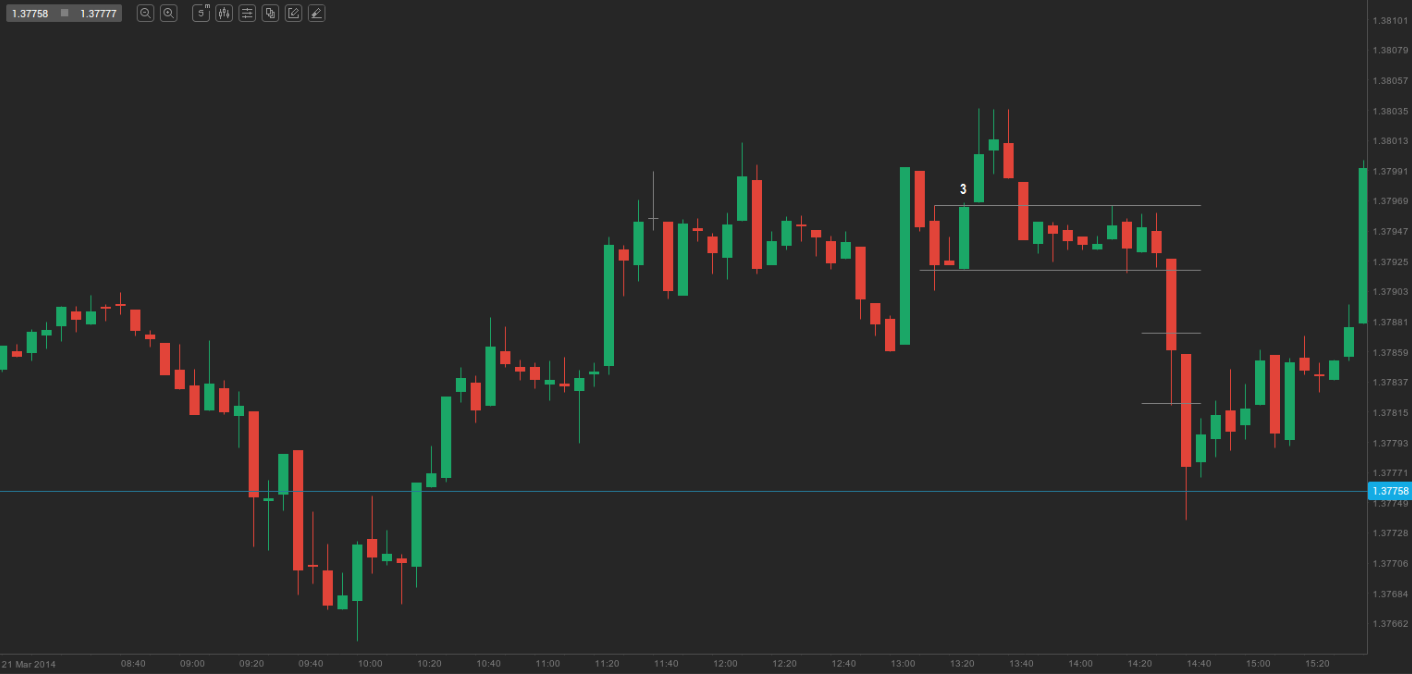
In the chart above, bar 3 breached the upper boundary of the horizontal channel (trading range), after which the price reversed. A breakout through the opposite side of the channel then occurred, as the large bear trend bar reached a low twice the height of the channel below.
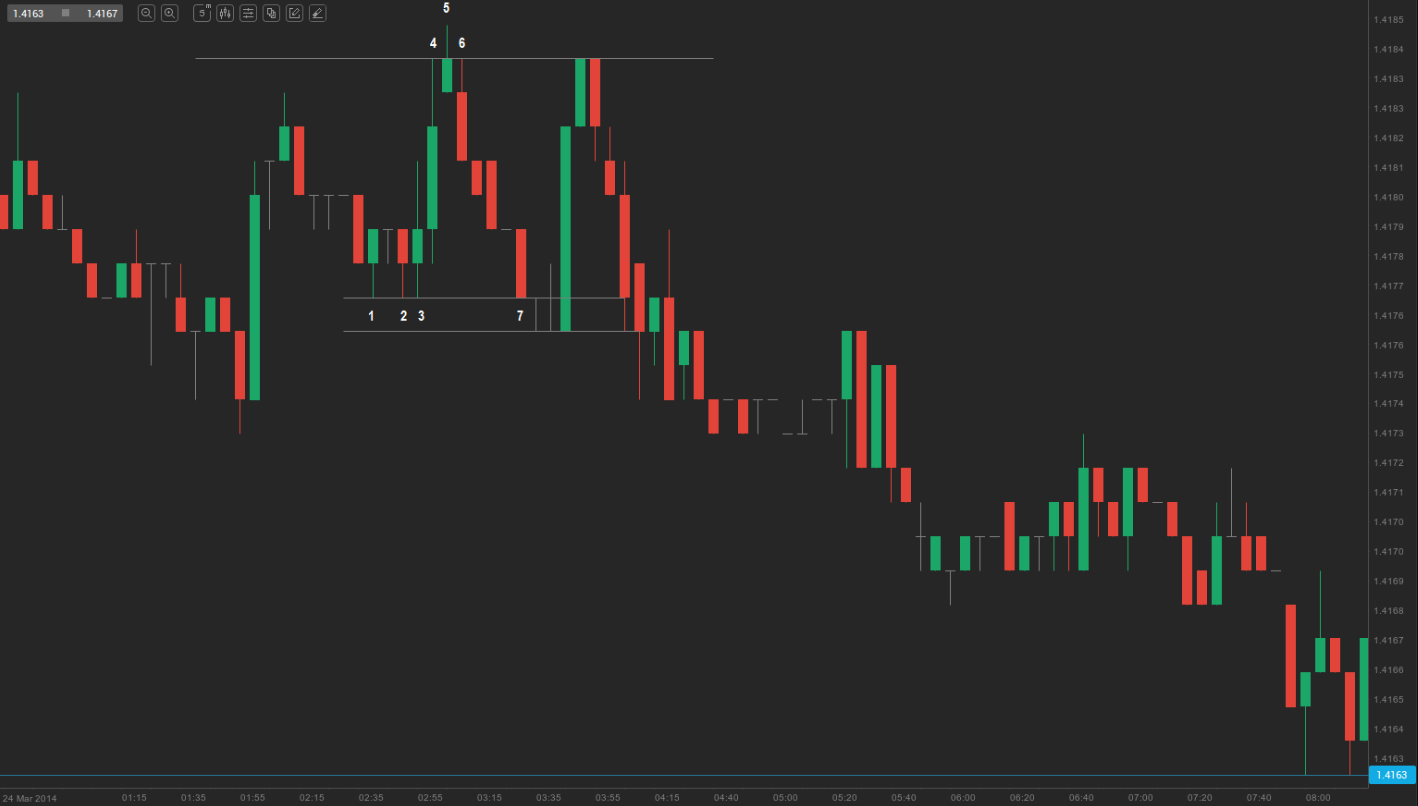
Here we can see a similar scenario. The market broke out of the horizontal channel (trading range) with bar 5, but the price then returned inside the channel and tested the lower boundary with bar 7.
Bull channel appearing in a bull trend
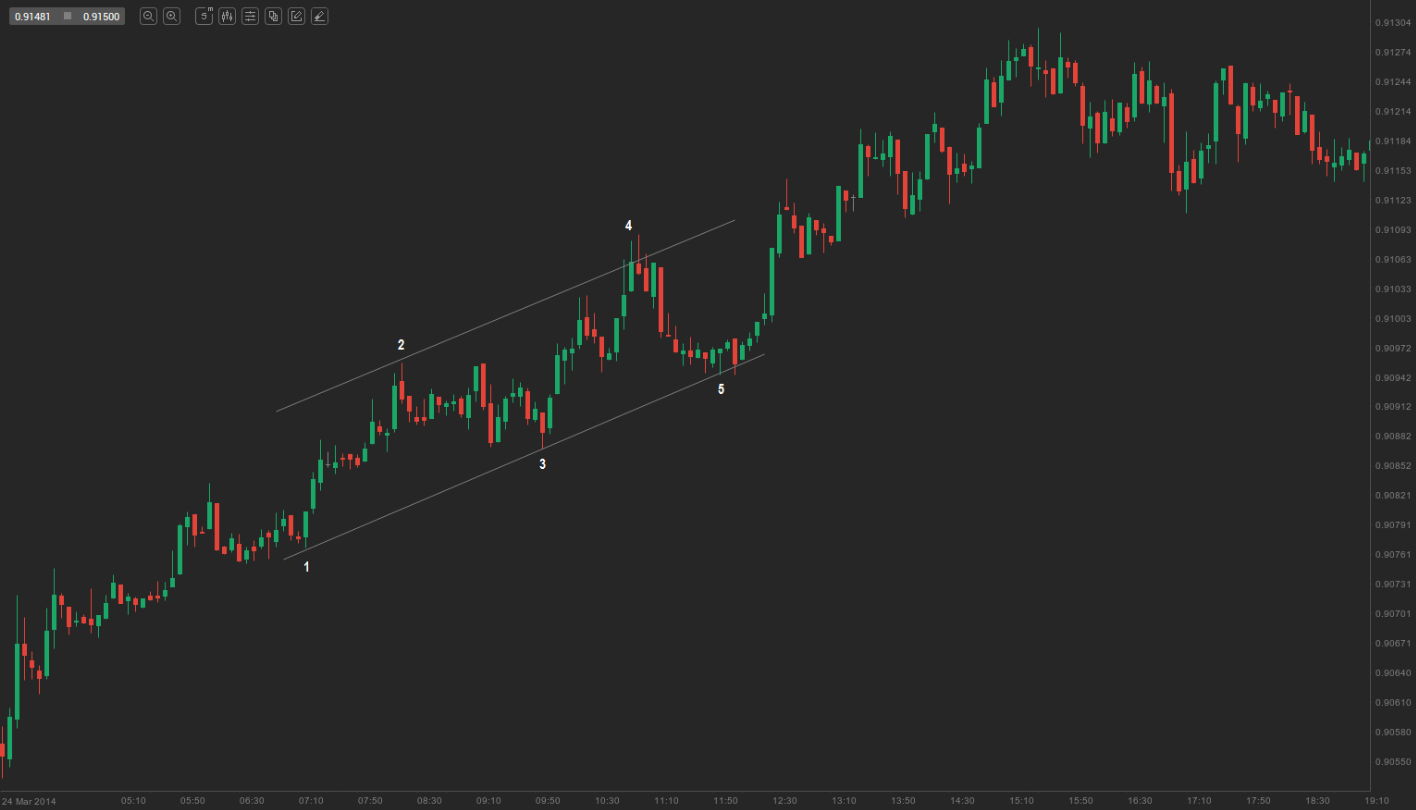
Bull channels can be detected in any type of market. In the chart above we can see a bull channel that formed within a strong uptrend. Prices moved up during most of the trading day, while no pullbacks occurred. Had any pullbacks been observed, traders would probably have bought them at or below the low of the preceding bar.
Bull channel appearing in a bear trend
In the chart above, the bull channel that formed was actually a wedge bear flag within a downtrend; therefore, it was not appropriate to look for a long entry. A short position could have been entered above the high of the shaved bull trend bar, or on any of the several bars that followed, because the market was always-in short.
- Trade Forex
- Trade Crypto
- Trade Stocks
- Regulation: NFA
- Leverage: Day Margin
- Min Deposit: $100
Breakout from a bull channel followed by a measured move
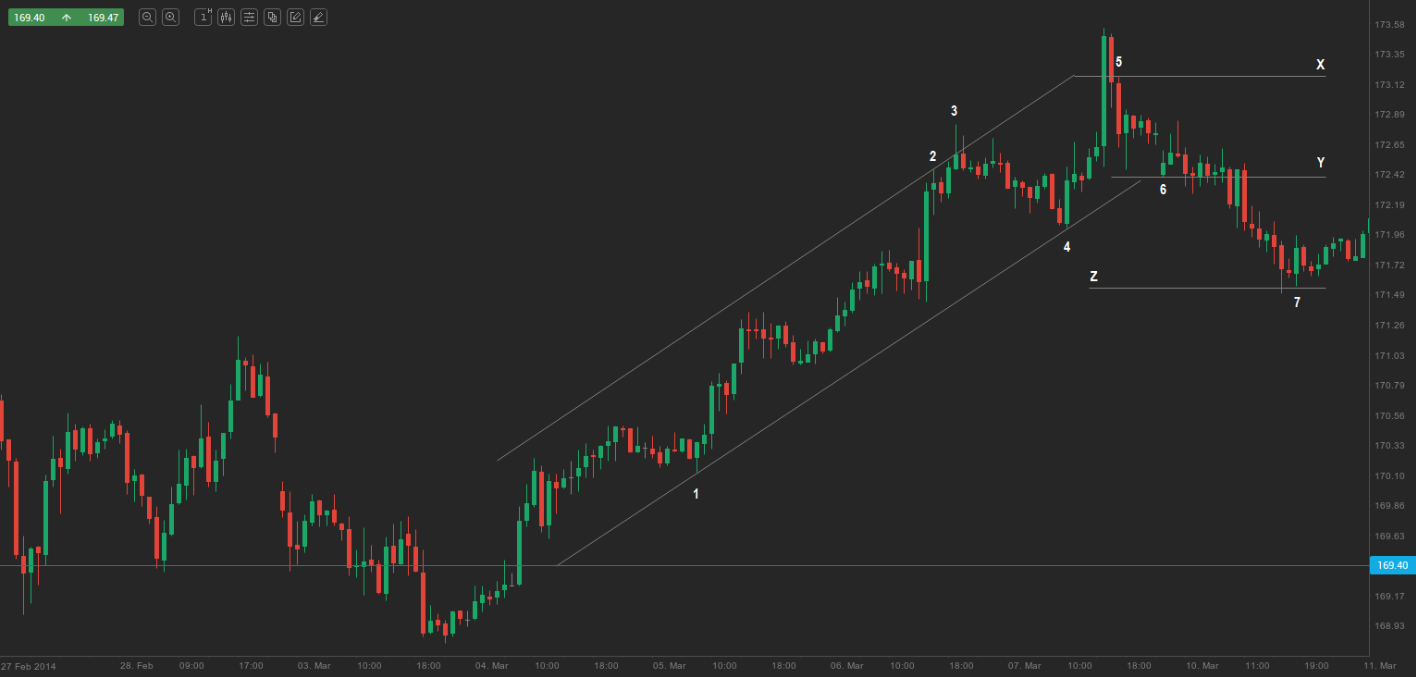
If the price breaks out of any channel, the first target is usually a measured move. In the chart above we can see another bull channel. Line X is drawn across the high of bar 5, while line Y is drawn across the low of bar 6 (the bar that breaches the trend line). Line Z is a measured move down from lines X and Y. Bar 7 found support at the measured move and the price continued to climb.