Basics of trend reversals and resumptions
You will learn about the following concepts
- Basics of trend reversals
- Trend resumptions
- Resumption instead of reversal
We’ve discussed the signs of strength in trends in previous articles, as well as when you can enter them. As you already know, market movement is rarely static – even the tightest trading range will eventually break out, and each strong trend will also eventually turn into a trading range or reverse in the opposite direction. In this article, we will discuss some of the basics of trend reversals before diving deeper into the matter later in our guide.
We know for a fact that even the strongest trends have pullbacks, no matter how shallow they are. As they become deeper, it indicates that the trend is losing momentum. At some point, the pullback will become so deep that it will look like a trend channel in the opposite direction – and, indeed, it is.
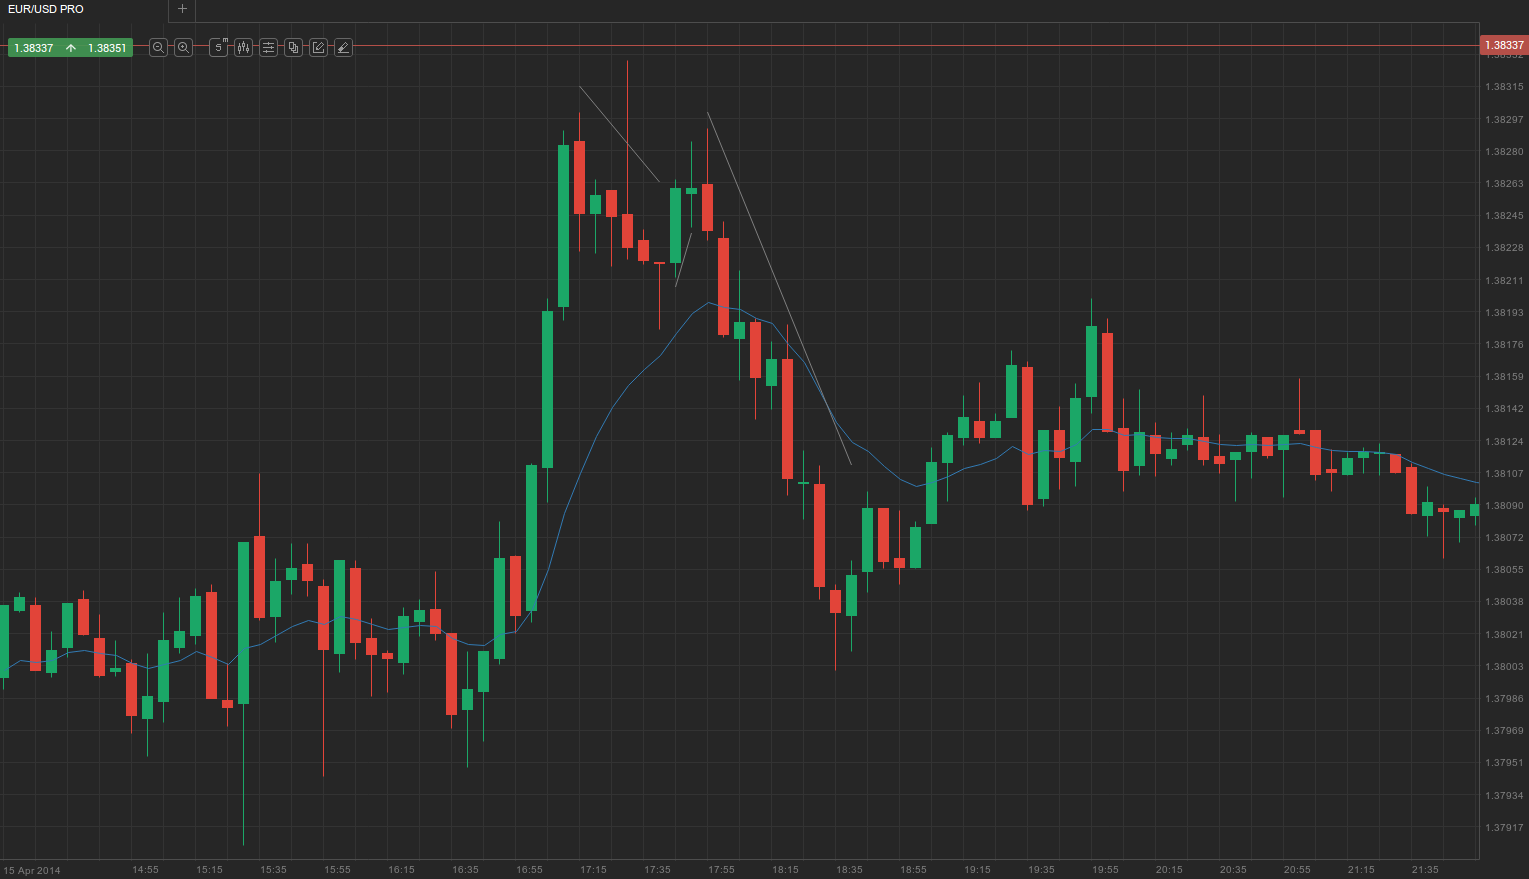
Most often, a trend reversal is preceded by at least one strong counter-trend spike (as we’ve mentioned, the first breakout attempts usually fail). For example, if there was a significant sell-off and you expect a two-legged test of the moving average back up, but the pullback begins with a strong bull trend bar, you should consider the possibility of this being a bull spike, which could then evolve into a strong uptrend instead of a bear flag.
If that is the case and the pullback shows some of the previously discussed signs of strength, you should refrain from entering further short positions and switch to buying.
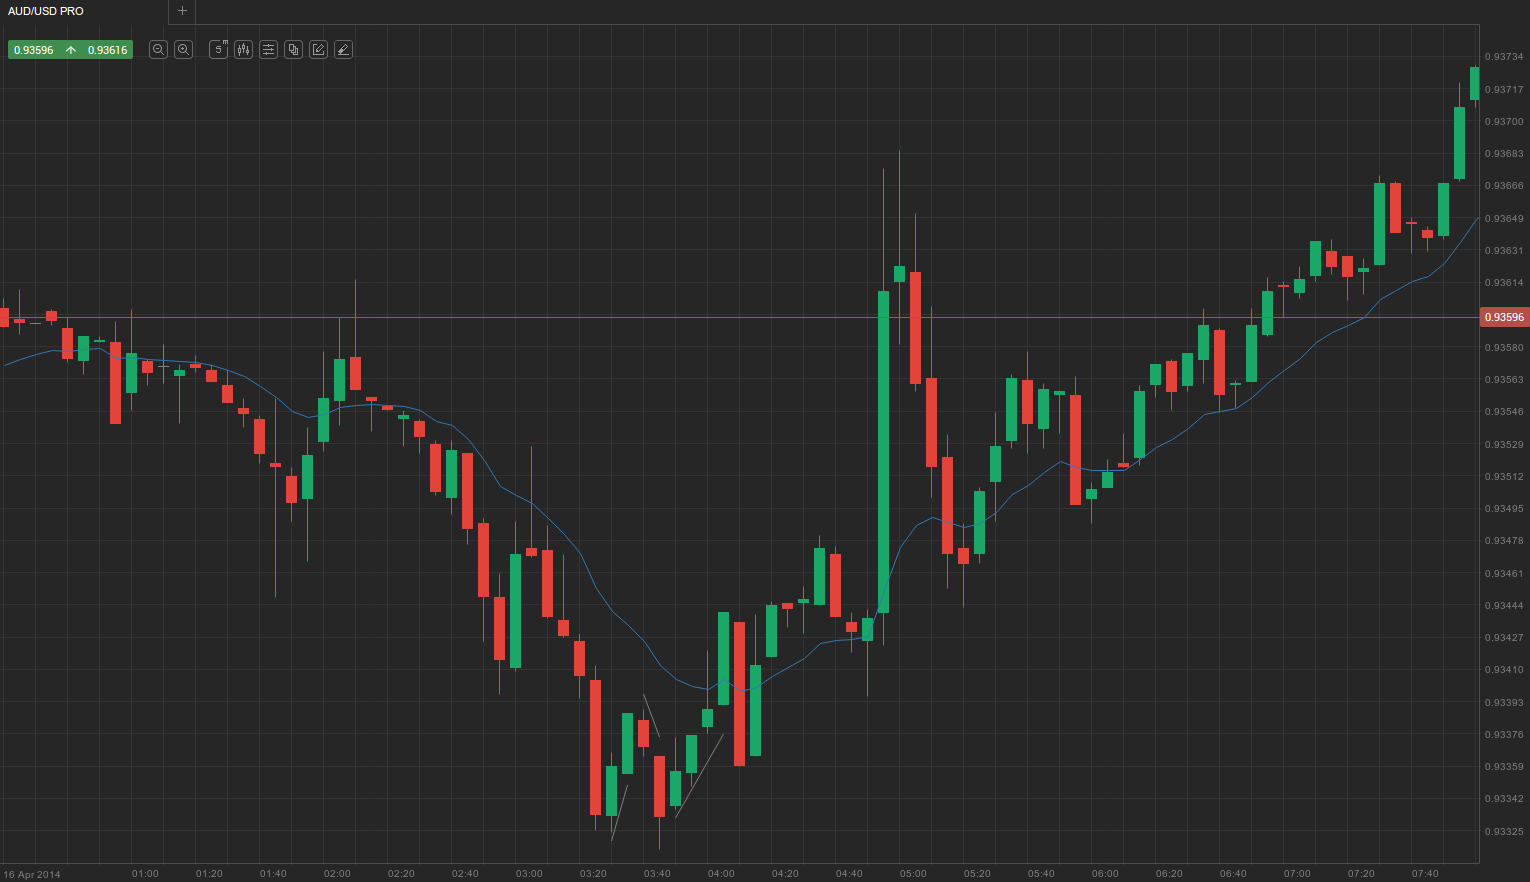
Often you will see reversals after a climax, especially after a sequence of climaxes. Consecutive climaxes usually lead to a two-legged correction in the opposite direction that lasts up to 10 bars. If there is a small pause or a shallow pullback after a pair of climaxes and it is immediately followed by another climax in the direction of the previous ones, the chances of an even greater correction improve substantially. Such a pullback could evolve into a trend in the opposite direction. Check out the following screenshot.
Trend resumption
 Often you can see the market entering a trading range for many bars after a protracted strong trend. When this happens, especially if the trading range was very tight, there is a good chance for the market to resume the previous trend. Although the breakout is usually in the direction of the initial trend, sometimes it can be in the opposite direction, thus forming a reversal.
Sideways trading, however, does not necessarily have to be tight and often provides tradable moves in both directions. Very often the market forms a wedge flag consisting of three counter-trend pushes, which traps traders who think it might be the beginning of an opposite trend. If the third push does not exceed the second, this will form a Head and Shoulders pattern, which tends to fail as a trend reversal more often than it succeeds.
![]() Instead of getting trapped, you should look for a reliable signal to enter the market in the direction of the previous trend. After the market has entered the trading range, both bulls and bears begin to scale in amid expectations of an imminent breakout. As that breakout occurs, if it is in the direction of the previous trend, the counter-trend traders, who have already reached their maximum position size while scaling in, can no longer add and instead exit their positions, further pushing the market in the breakout’s direction.
Instead of getting trapped, you should look for a reliable signal to enter the market in the direction of the previous trend. After the market has entered the trading range, both bulls and bears begin to scale in amid expectations of an imminent breakout. As that breakout occurs, if it is in the direction of the previous trend, the counter-trend traders, who have already reached their maximum position size while scaling in, can no longer add and instead exit their positions, further pushing the market in the breakout’s direction.
Sometimes the market will not enter a trading range after a strong trend but will instead form a wedge, which acts as a trend continuation pattern. For example, after a strong sell-off, the market often rises with three pushes up and retraces most of the preceding trend. However, if the rally demonstrates slower momentum than the previous trend, you should be ready to expect a bearish breakout from the wedge and a trend resumption.
You can go short either at a breakout below the wedge or after a breakout from the top that reverses back down. If you don’t enter on the breakouts, you can alternatively wait for the bear trend to resume and then short on a pullback or near the moving average.
Reversal instead of resumption
 Although strong trends are most often resumed after they have evolved into a tight trading range, with the second part of the move roughly the same size as the first, sometimes a reversal occurs. Usually the trend is resumed after a failed counter-trend breakout from the trading range, but that is not always the case, as pictured in the following screenshot.
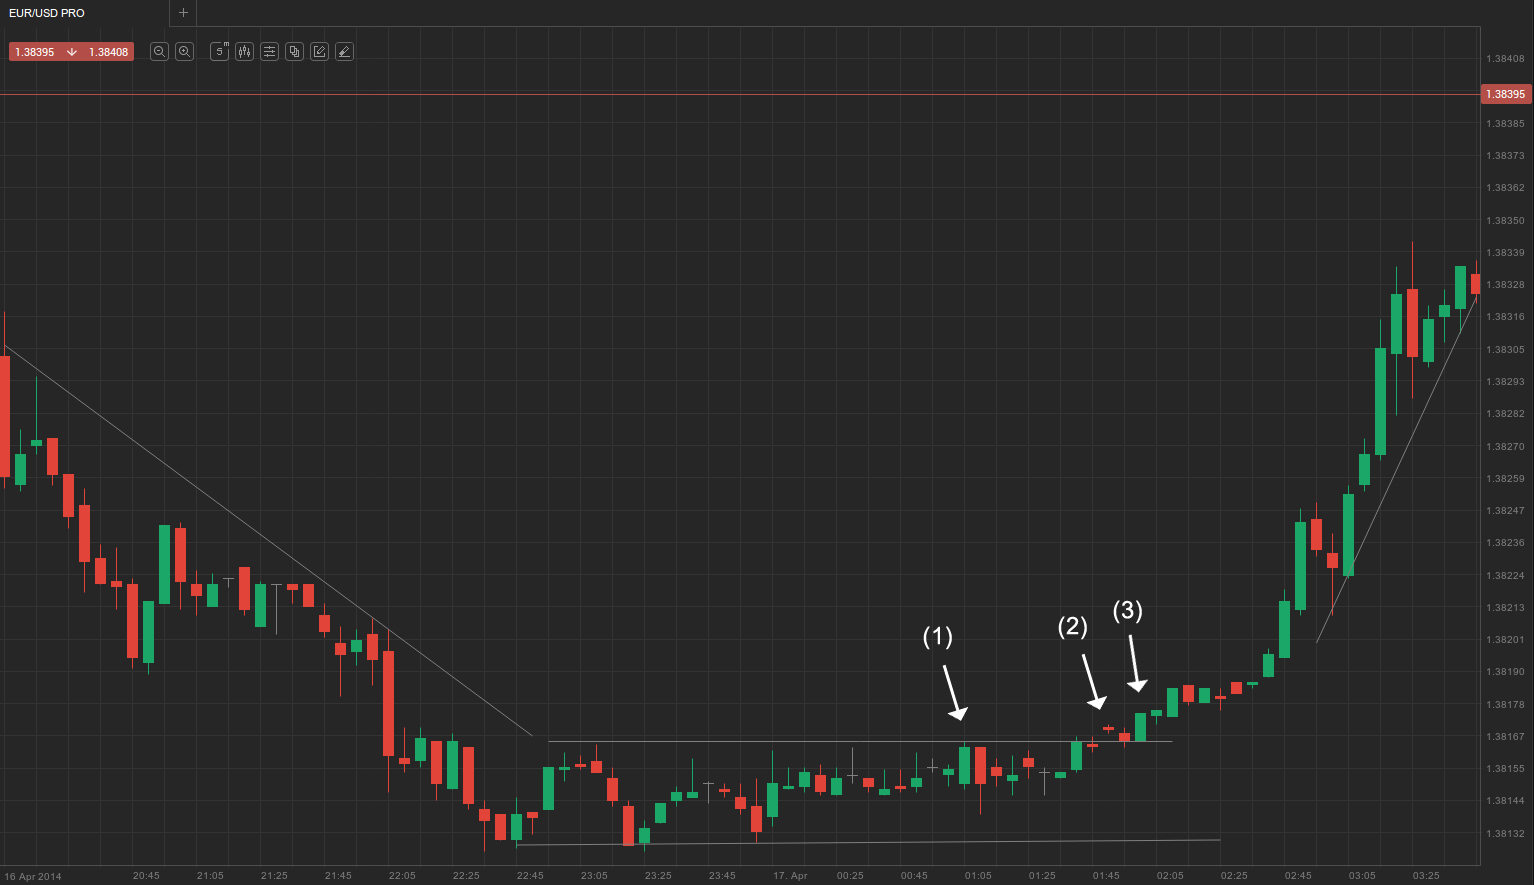
Very often you can see a trading range break out and continue the initial trend, with the second move being as extensive as the first. The continuation is preceded by a failed counter-trend breakout from the trading range. However, in the screenshot above you can see that this wasn’t the case.
Within the trading range was a two-bar reversal, marked as (1), which, however, failed to push the market down to the bottom of the trading range. As the price edged higher to test the resistance zone again, there was a breakout at (2), which first seemed like a possible failed breakout because the bulls couldn’t manage to push high enough and the bar closed lower, closely resembling a doji. Many traders might have thought this was a good place to go short, but they would have been wrong not to wait for confirmation.
As the market pulled back to test the resistance zone, it now clearly acted as support, not allowing the price to return within the trading range. Bar (3) clearly reflected who had control of the market. As bulls pushed higher after the upward breakout, the double-shaved bull trend bar indicated with a high degree of certainty that the trend was reversing. Confirmation followed, with a top-shaved bar and another double-shaved bar.