
Hello there, this is tradingpedia.com, and this video deals with trends and trendlines. Basically we will look at what a trend is, the rules of a trend, and what changes a trendline or how can we adapt the trendline based on how the market is moving.
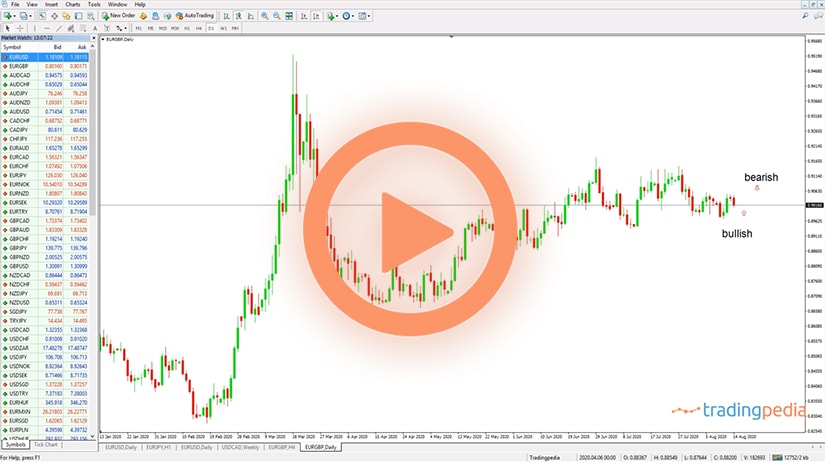
This is the GBPUSD 4h chart, it shows the recent price action on the pair. We see it recovering dramatically from March 2020 lows from 1.14 to 1.32. Keep in mind that everything that we discuss here, remains valid for any market. No matter what you trade, as long as the market moves, trending conditions may appear.
A Trend is Your Friend
 A trend is your friend, it is said by traders all over the world, and for a good reason. A trend is made by a series of higher highs and higher lows – that is a bullish trend. For example, the market bounces from the lows, and then makes a high, corrects a bit, makes another high, higher than the previous one, a higher high, corrects again, and so on. This series of higher highs in combination with a series of higher lows, are the prerequisites of a trend.
For as long as these series remain in place, the market will not reverse. Shorting such markets is dangerous, it should be done with limited risk, and the ideal way to trading them is to look for continuation patterns, like pennants, flags, and so on.
In a rising market you will focus on the series of higher highs, but also at the same time to fail to break the series of higher lows. These are trending conditions – imagine a trendline that connects these points. Basically, the trend is rarely a straight line, as some pullbacks do exist. In a trend, various market participants come on the long side, and then profit taking takes place, the market pulls back a bit, and so on.
If higher highs and higher lows are the characteristic of rising trends, then lower lows and lower highs are the characteristics of falling trends. For instance, the GBPUSD from 1.35 it fell to 1.14, but during that move lower, it actually formed a low, and then a lower high. Then another low came, a lower low, and a bounce that formed a lower high.
These are also trending conditions. A trend is not necessarily aggressive, and in the end, it forms a series or lower lows and lower highs.
Trendline
 How about the trendline, how do we adjust the line of trend? We see that the market here fell, and then suddenly bounced and made a higher low.
If we take a trendline trying to connect these ones here, we see that the market broke it. What should we do – does it mean that the trend ended? No.
The way to treat it is to adjust the angle of the trendline by respecting the higher high and higher lows series. For instance, the market broke the trendline, it even broke the previous lower high, so we delete it, then reverses and makes a new higher high when compared with this one. From the moment that it made a new higher high when compared with this one, we take the trendline and connect the absolute low with the higher low and we follow the same principles.
We see that the market broke the trendline, but without breaking the previous lower high. This is a bullish sign, because it is for the first time when we have in place a series of lower highs. So when the market makes a new higher high, all we have to do is to adjust the trendline and drag it on the right side.
Bearish Trend
 The same thing can be done on a bearish trend and adjust the trendline and by the time that the market breaks the bearish trendline, we have a confirmation that a reversal is in place.
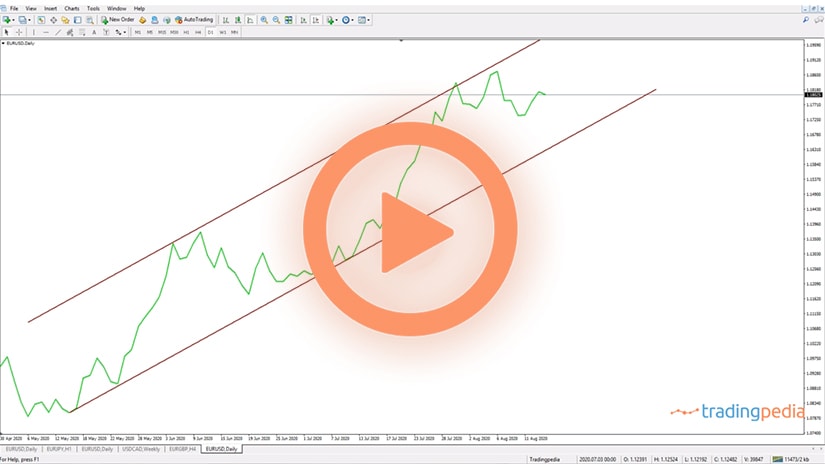
Trendlines are used in rising and falling markets to build channels as well. For example you can copy this trendline and project it from the first higher high, trying to find out dynamic resistance.
Trendlines, while broken, suggest that the price is in trouble. But if the market keeps the series of higher lows in place, the rising trend remains valid. These principles work on any market, timeframe, and the bigger the timeframe, the bigger the implications for trends and trendlines.
Related Videos
Focus on the series of higher highs and higher lows and lower lows and lower highs in bullish, respectively bearish trends. Draw a trendline from the absolute low to the first higher low in rising markets, or from the absolute high to the first lower high in bearish markets and adjust the trendline with every market dip or spike higher but only if the market does not break the series of higher lows or lower highs.
This way, you will always end up on the right side of the market.
A Simple Way to Use Trends and Trendlines
 Riding a trend is every trader’s dream. It represents the simplest way of growing a trading account, providing trending conditions exist.
Unfortunately, financial markets spend a lot of time in ranges. Triangles, for example, are one of the most popular technical patterns, but triangles are known for their extensive ranges.
Because ranges form so often, traders’ patience is tested often. There is a saying that the trader should “let the profits run.” But if the market is not moving, the trader most likely loses her patience and exits the trade.
There is also a cost-related factor. Most of the swaps in the currency market (i.e., the cost to pay or benefit to receive by holding a position open overnight) are negative, putting pressure on traders willing to run a trend for days in a raw.
As such, traders must adapt their style and try to make the most of trends and trendlines. The remainder of this article focuses on how to quickly adjust to changes in trending conditions and also how to be a contrarian trader from time to time.
How to Ride Trends – EURUSD Examples
A trend is either bullish or bearish, rising or falling. Any trend is made of:
- A series of lower highs and lower lows – bearish trend
- A series of higher highs and higher lows – bullish trend
Unless the market reverses and breaks the series, the best course of action for traders is to trade in the direction of the trend. Contrarian trading does make sense too, but it is far riskier than trend trading and often leads to bigger drawdowns than originally intended.
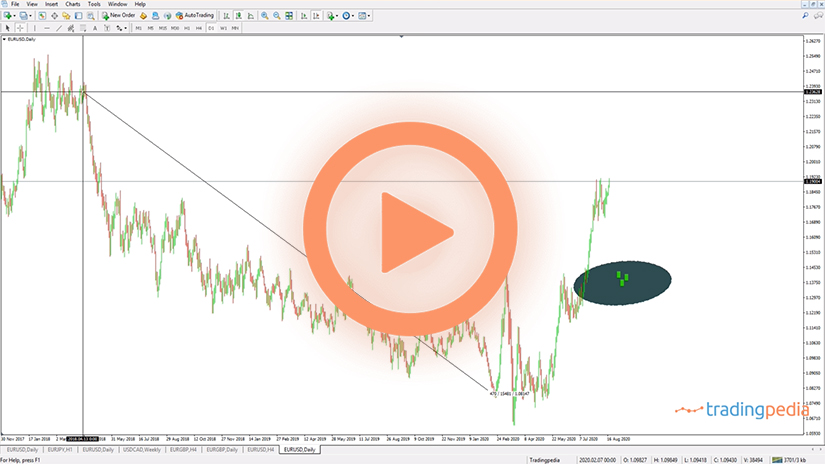
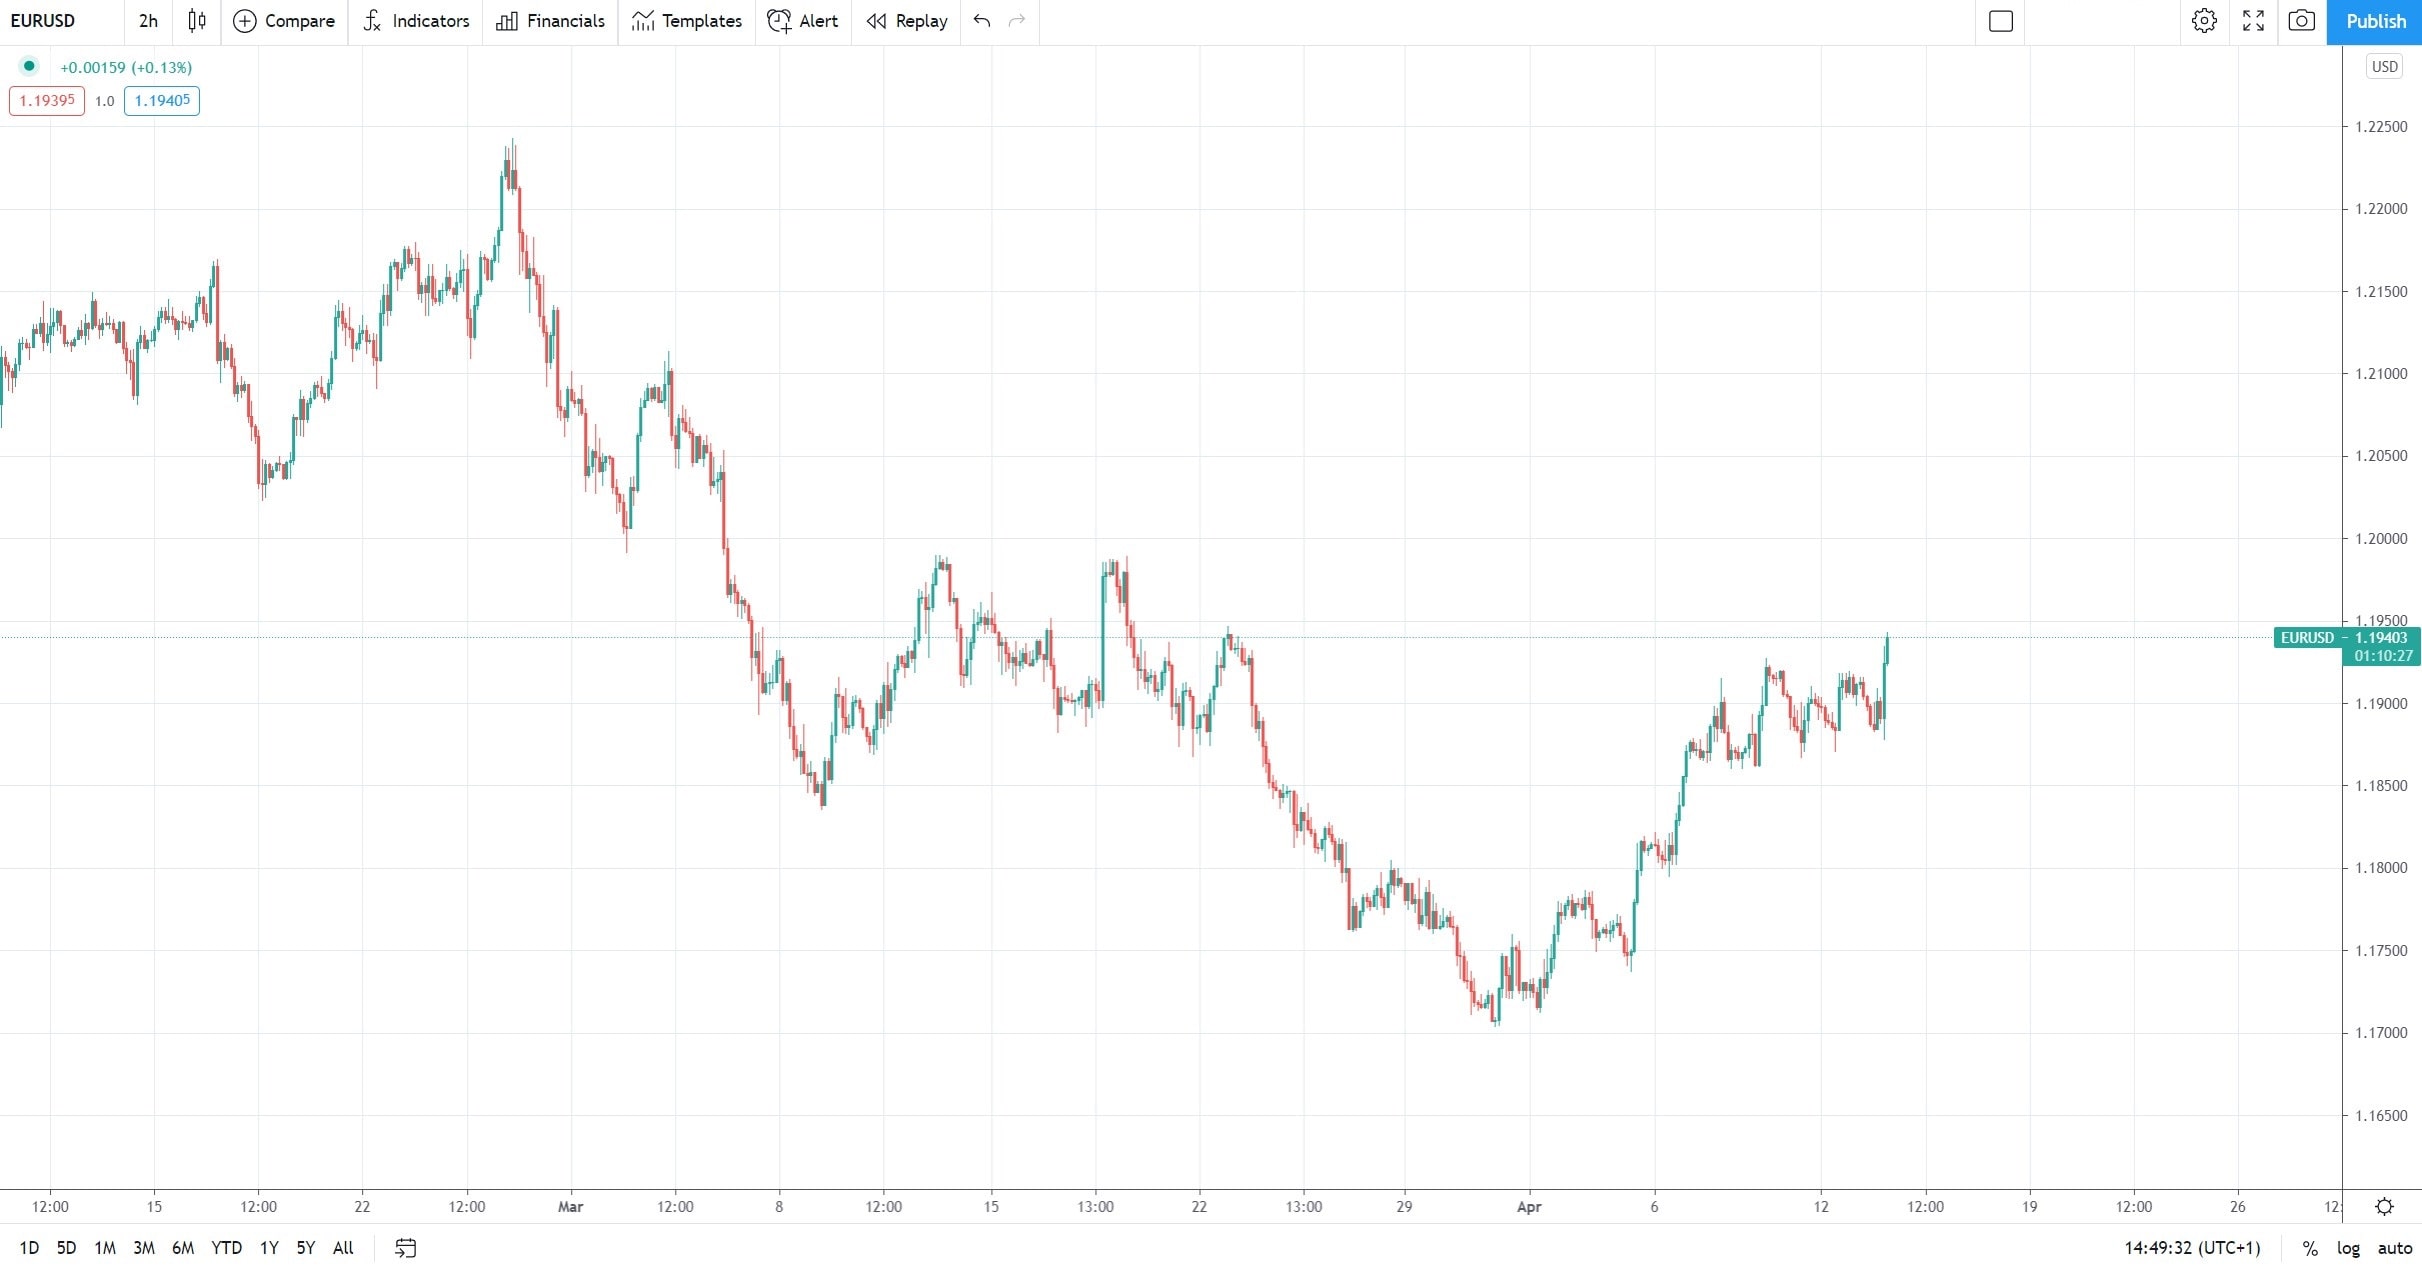
The chart below shows the recent price action on the EURUSD pair. The decline from 1.2250 represents a bearish trend that respects the definition, and the market currently attempts a reversal.
A trendline is the line of the trend, so the first thing to do is to make sure it is drawn correctly. In a bearish trend, the trendline must start from the highest point in the previous bullish trend and connect the first lower high. By projecting it on the right side of the chart, traders obtain the line of the trend.
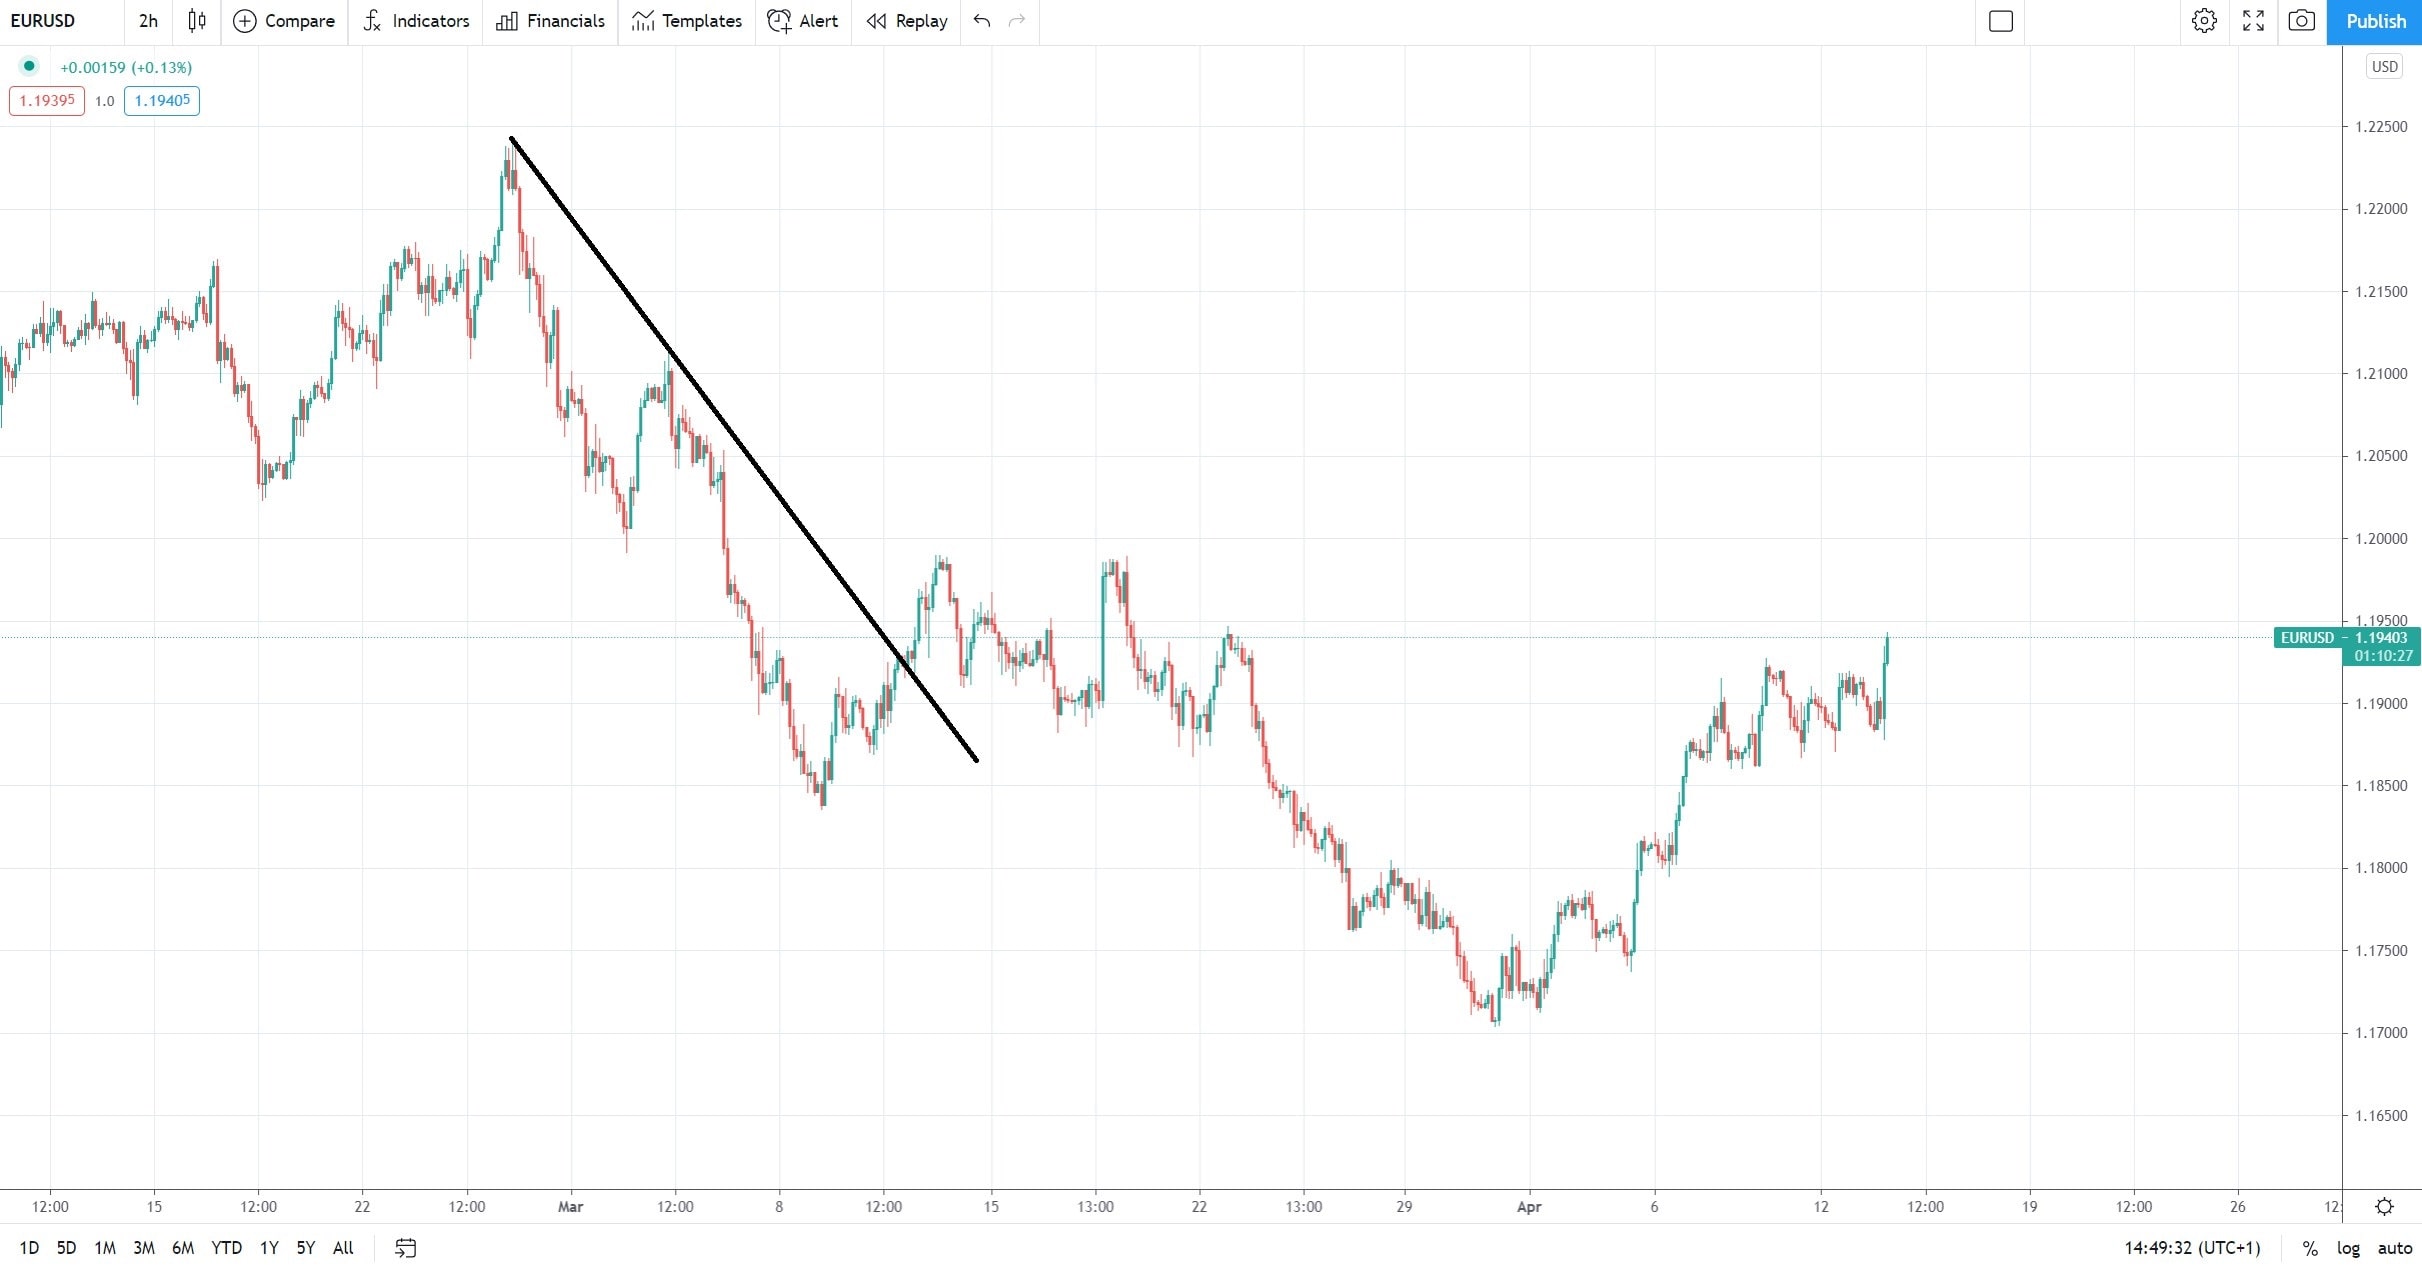
But the line often changes. How do we know that the trendline’s breakout is real or false? How to avoid being trapped on the wrong side of the market? The answer comes from the lower highs series – unless the market is strong enough to surge above the previous lower high, the bearish trend remains in place.
Contrarian Trading at Dynamic Levels
 From time to time, even trend traders feel the need to take the opposite side of a trade. If dynamic support or resistance levels are correctly identified, contrarian trading may be successful.
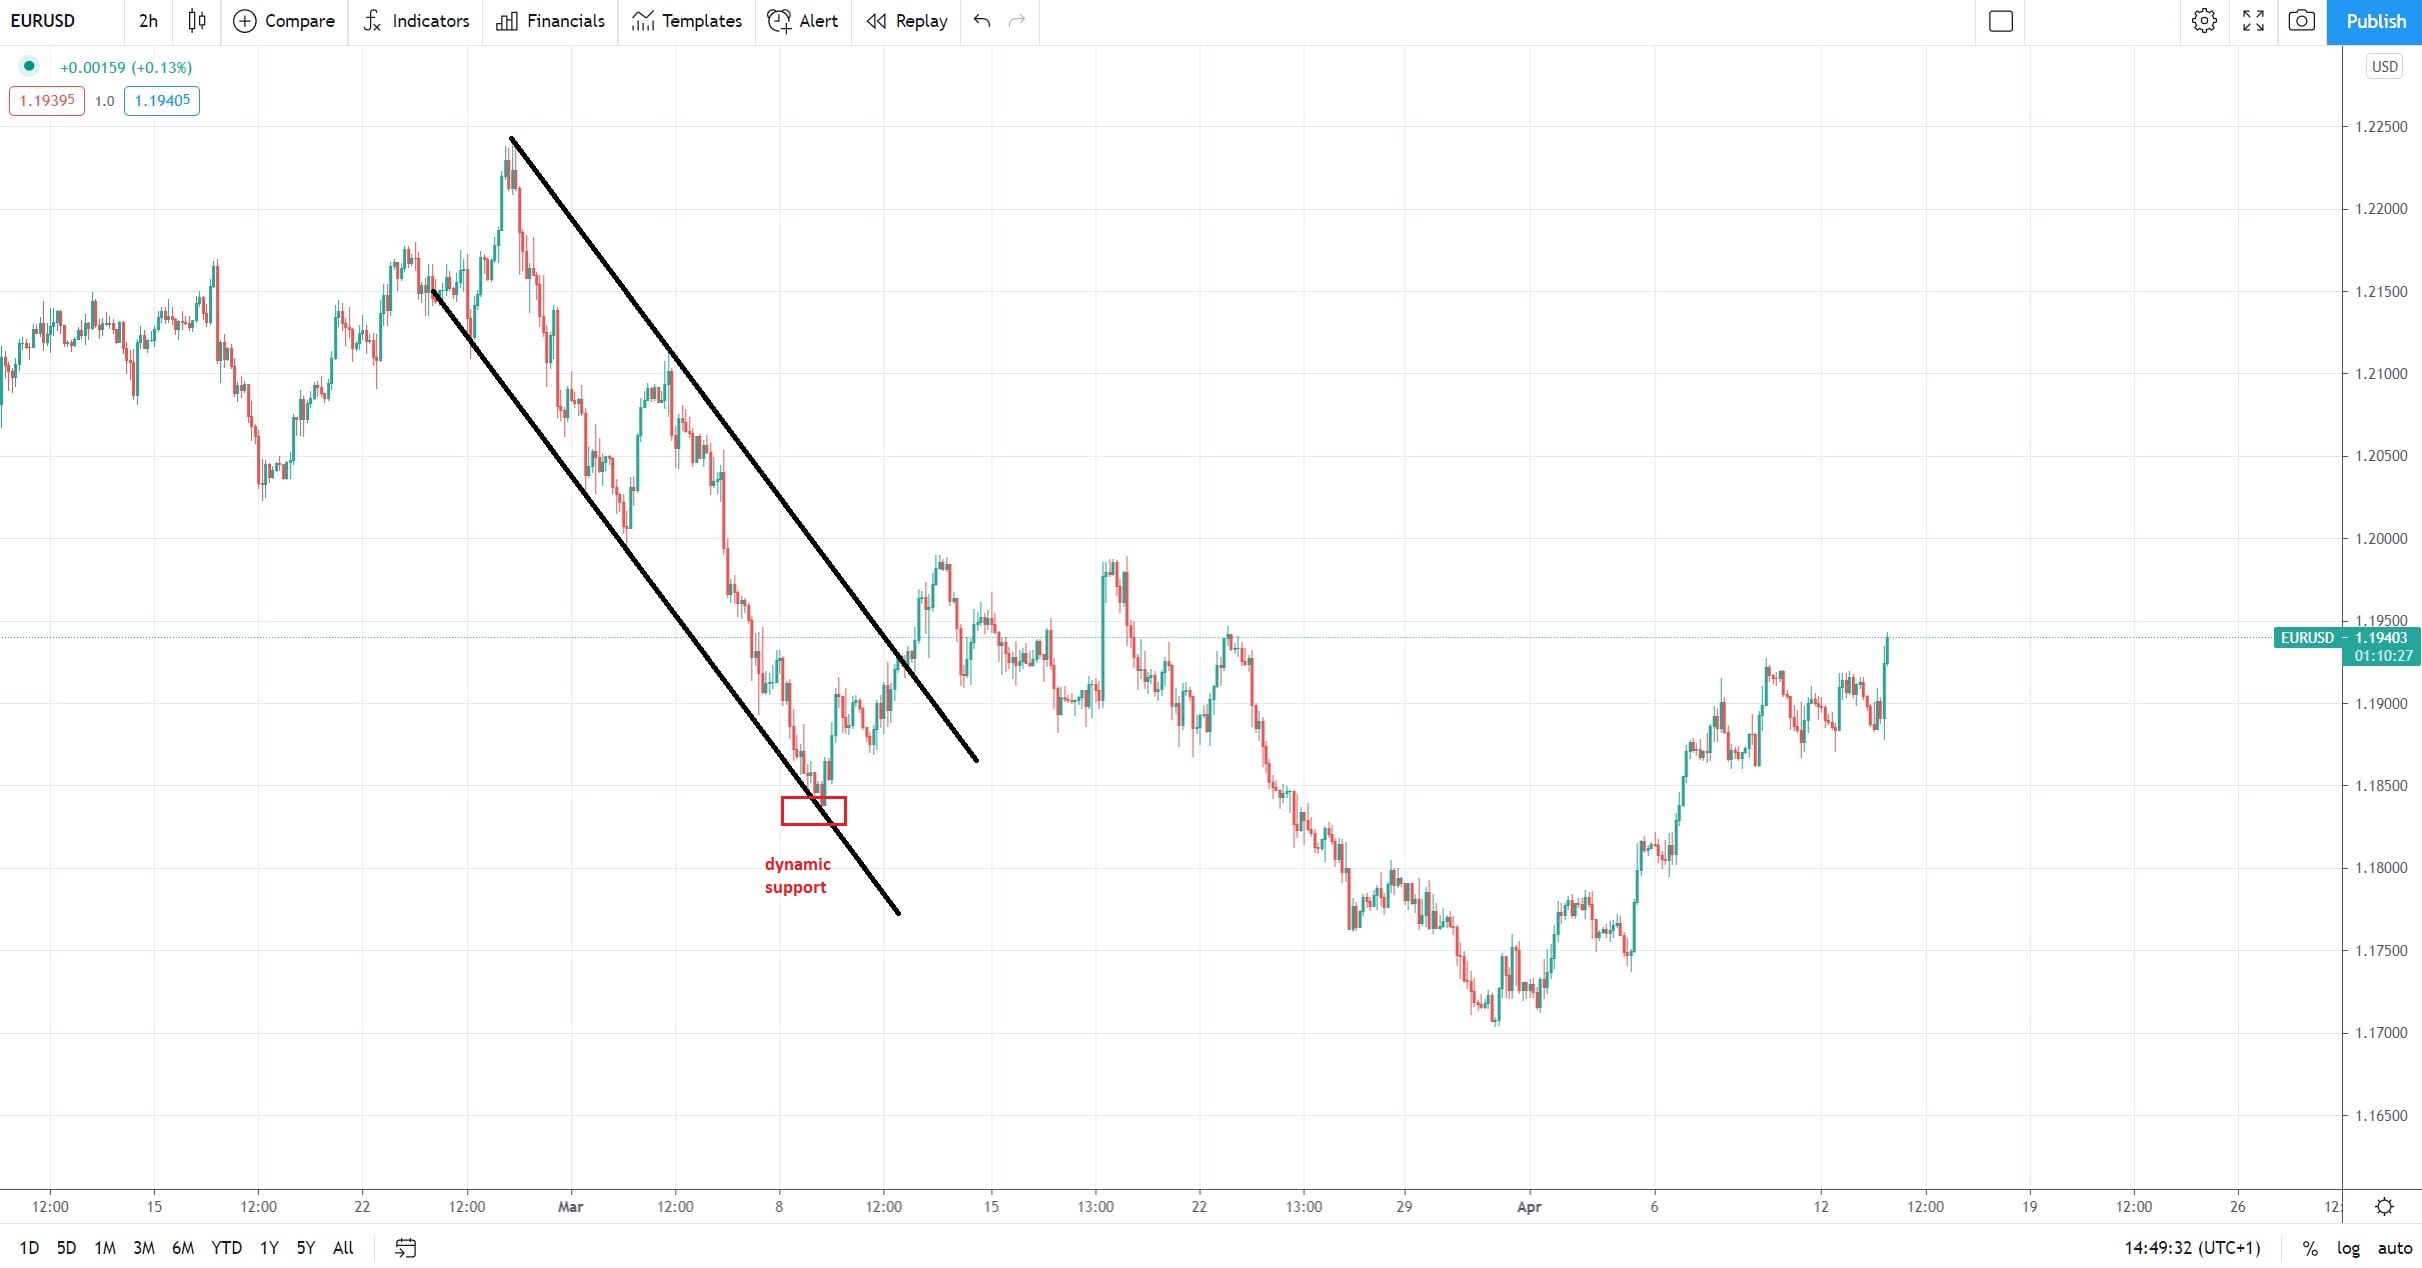
By projecting a bearish trending from the first lower low in the series, traders can build a so-called bearish channel. When the price meets the opposite side of the channel, it meets dynamic support.
A bounce from there is possible, albeit not mandatory. Ideally, traders should wait for another reversal pattern to form at dynamic support, such as a hammer or a morning star formation.
Adjust the Trendline on a New Lower Low
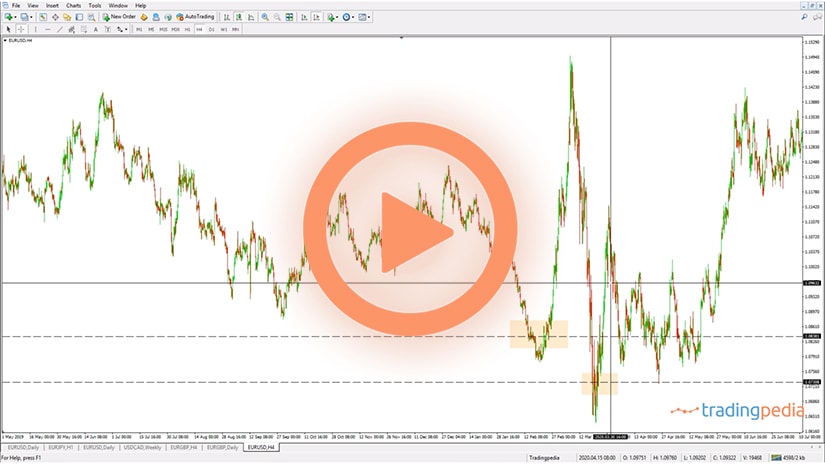
 The previous chart shows the EURUSD price action breaking the bearish trendline. But is this break false or real?
As mentioned earlier, traders should wait for the price action to rise above the previous lower high. If the market fails to do so and instead falls to a new lower low, it means that the bearish trend is not over.
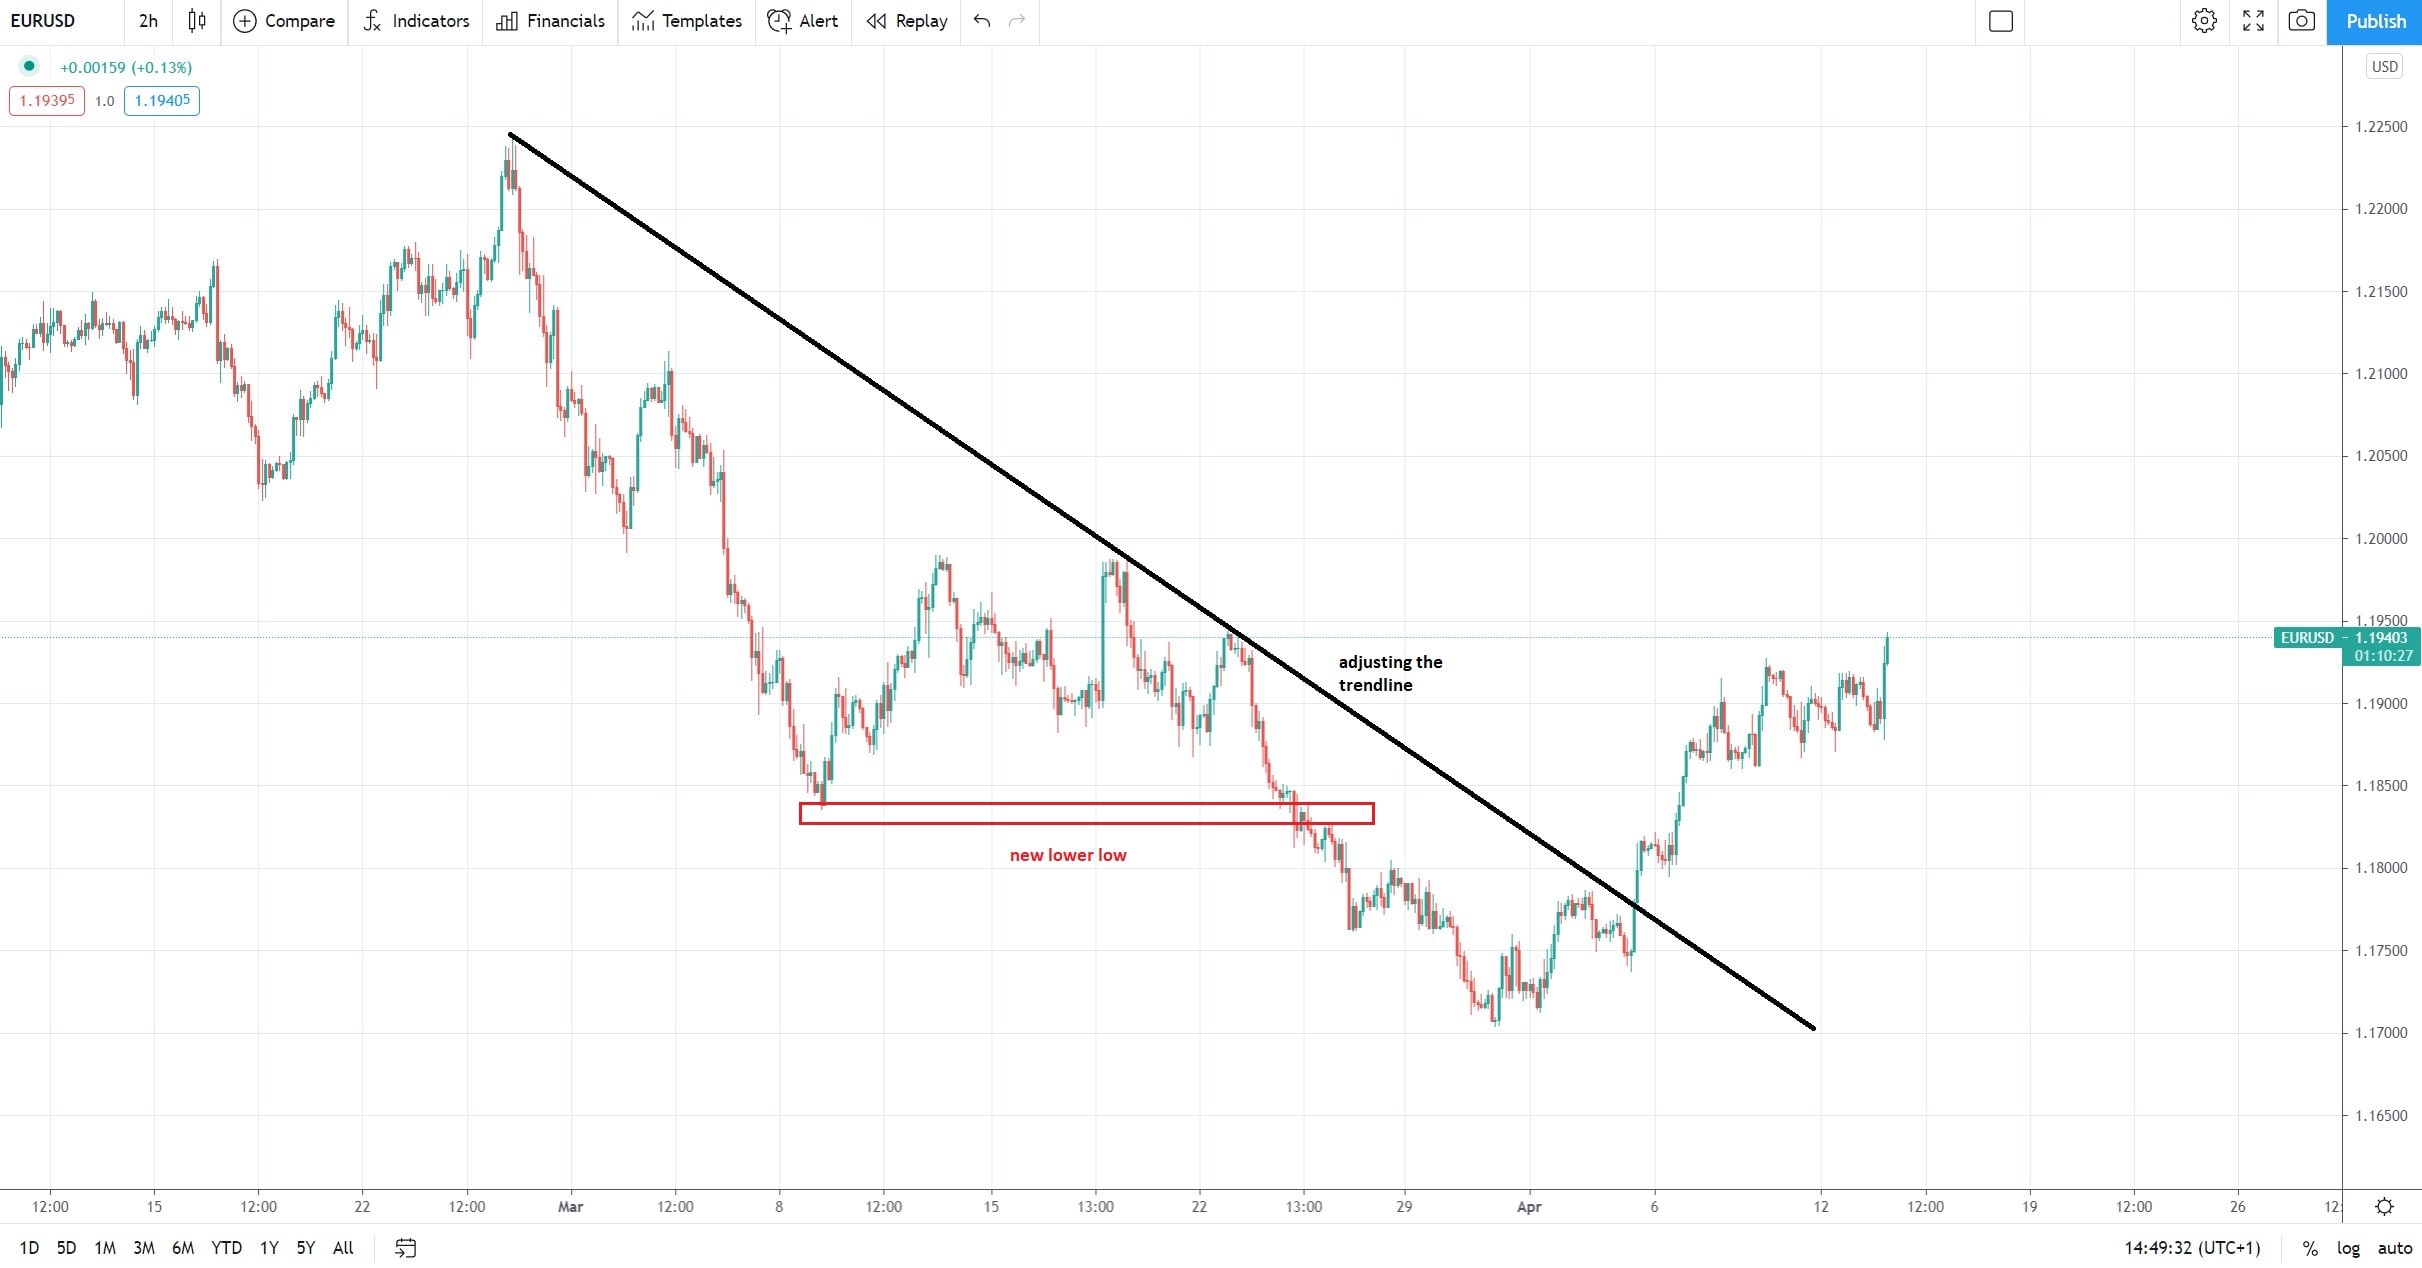
Therefore, the only thing that remains is to adjust the original trendline to the new market conditions. Adjusting is done after the market forms a new lower low and the trendline now connects the original high to the new lower high.
Trendline Break and Series of Lower Highs Invalidated
 Unless the trading conditions mentioned so far change, the market remains in a bearish trend. As such, the trendline defines its trend. But what happens if the price changes course and breaks the trendline? If that is the case, the trader must wait for the price to break the previous lower high series.
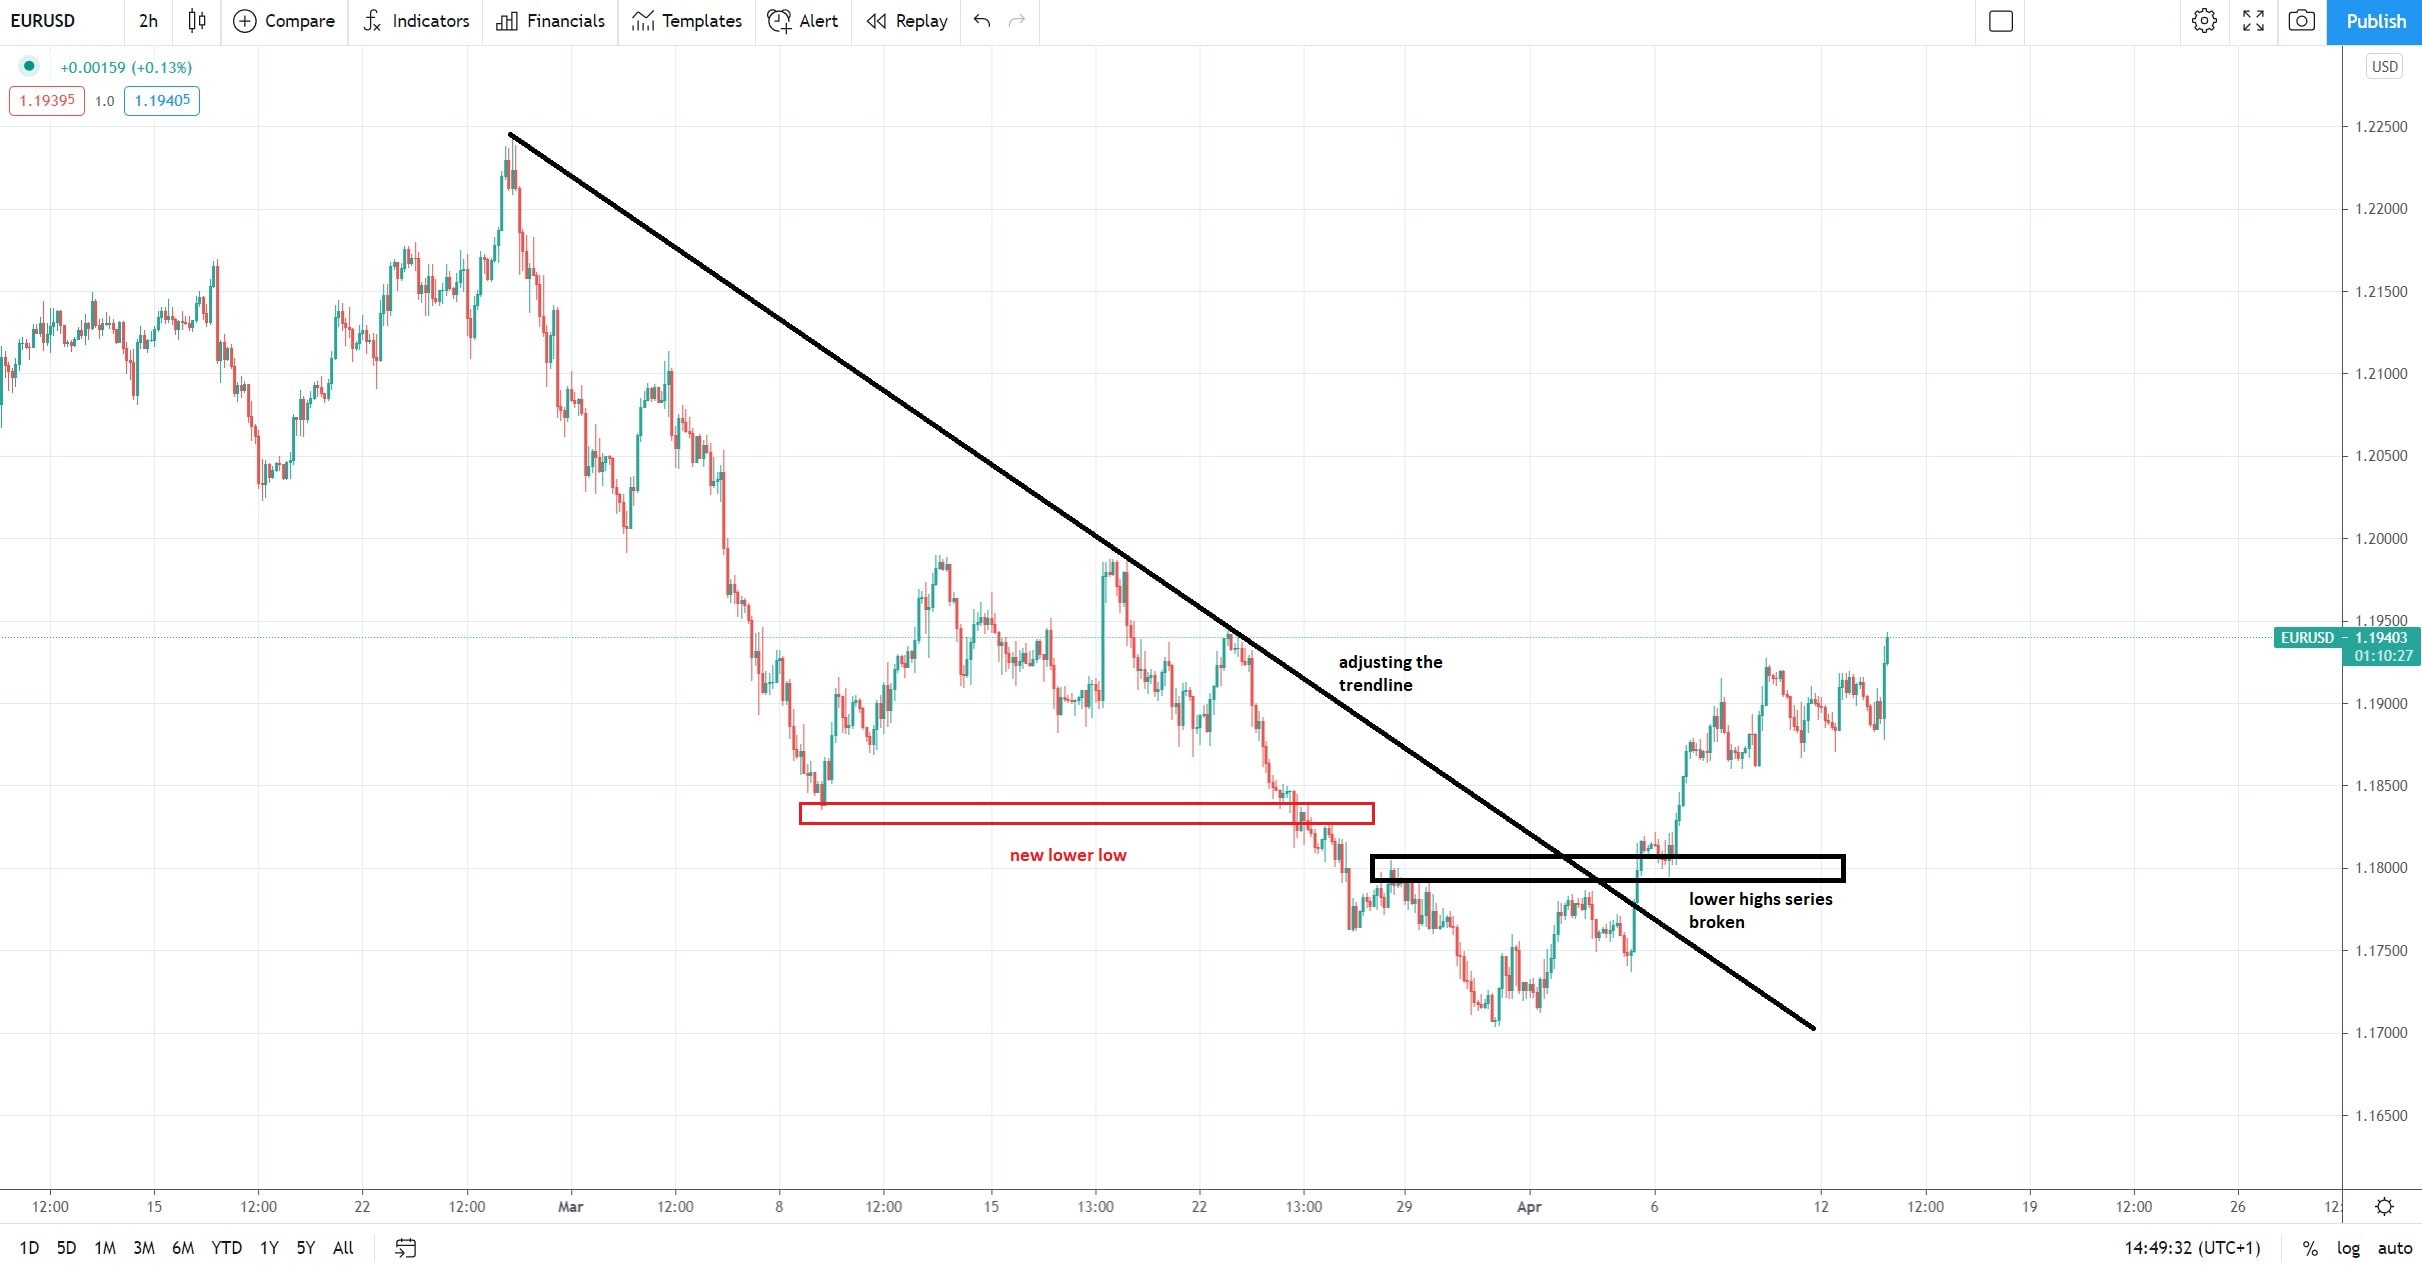
Let’s move the focus to the chart above. The trendline’s break coincides with the price making a move above the previous lower high.
Effectively, it means that the bearish trend ended and a new bullish trend started. From this moment on, the focus shifts to how to run the bullish trend, and it all starts with identifying the new, rising trendline.
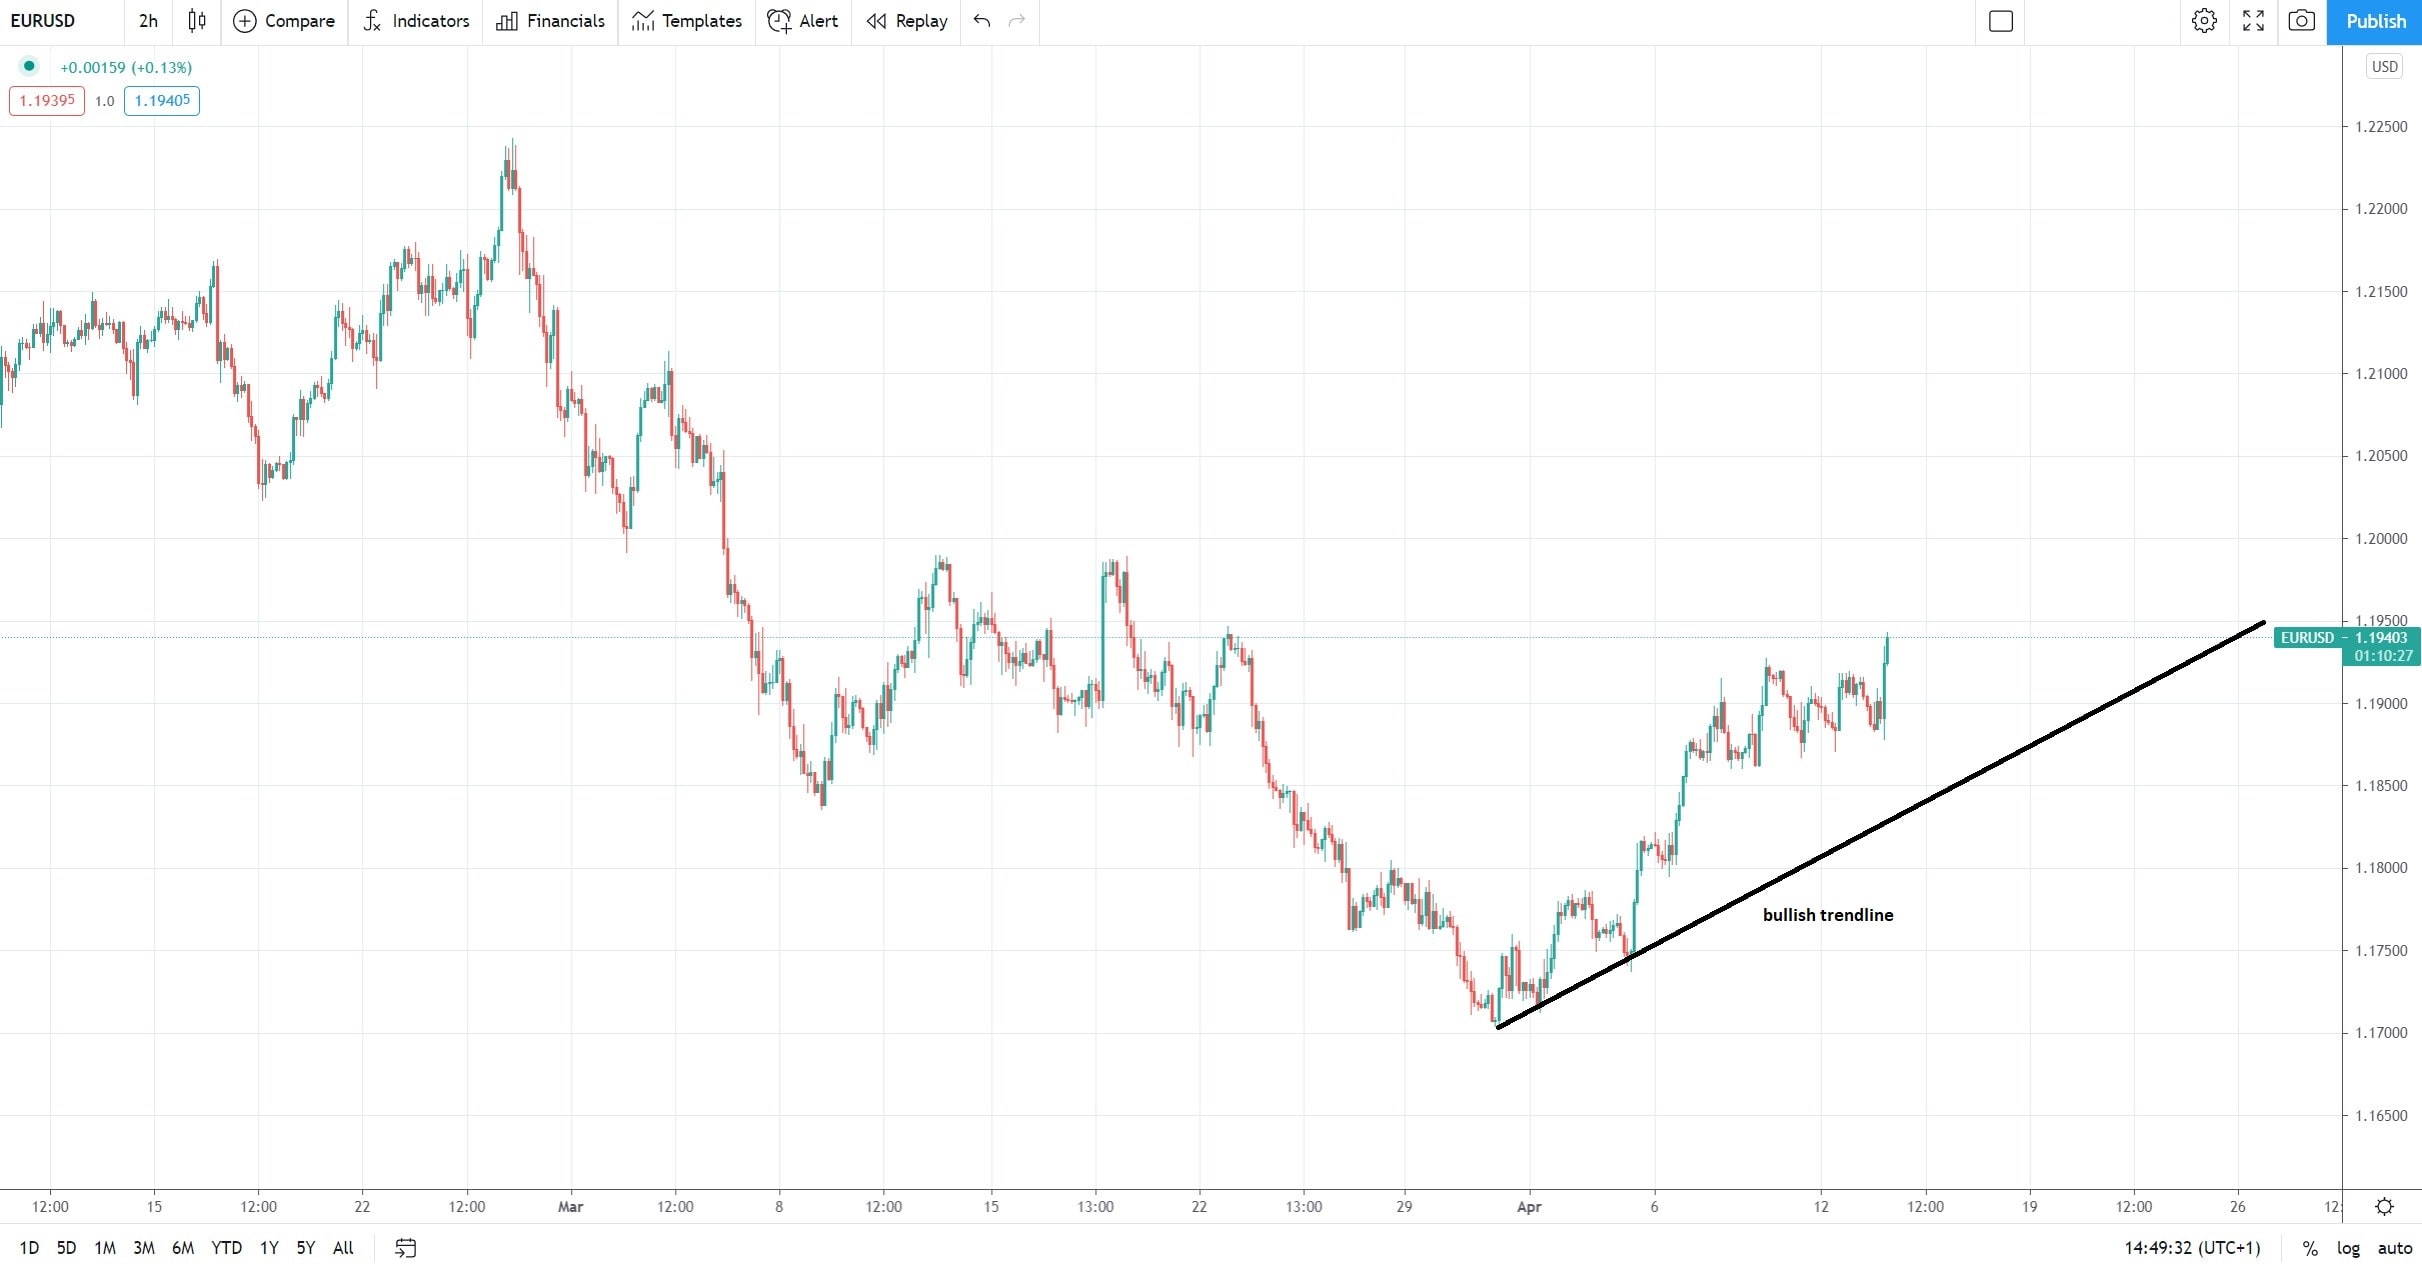
To do so, we must follow all the previous steps and apply them to a bullish trend. First, we need to identify the lowest point in the previous trend – this is where the new, rising trendline starts. Second, we connect that point to the first higher low, and wait for the market to form a new higher high. This way, we make sure than a new trend is in place.
To sum up, riding trends is extremely rewarding, as long as the trader follows a rigorous process. Many times it is tempting to break the rules and take a trade in the opposite direction, especially due to fundamental, economic news.
A trend is a trader’s friend, and the bigger the timeframe, the stronger the support or resistance projected by the main trendline. Imagine everything discussed in this article but on the weekly or monthly chart. A bigger timeframe gives the trader more confidence that the trendline will hold at the first attempt to break it.
Finally, as a rule of thumb for trendlines, the more often the price action retests a trendline, the weaker the trend becomes. Therefore, by the second or third attempt, the trader is better off to avoid trading the implied support or resistance, and just wait to see what the market does next.