
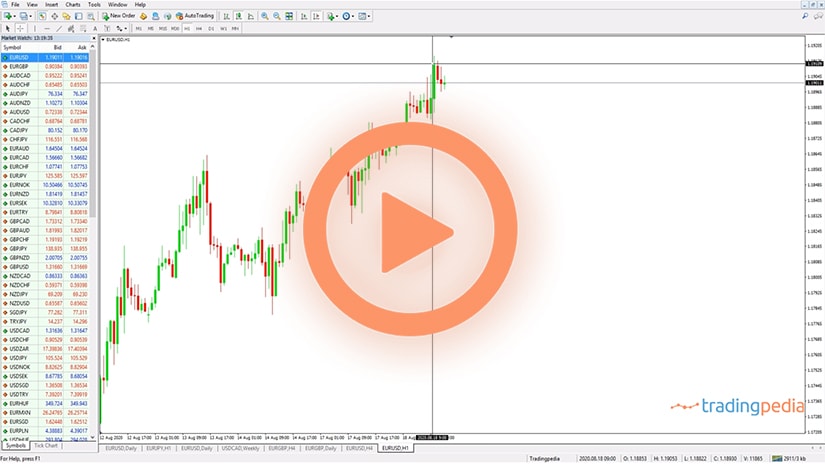
Hello everyone, this is tradingpedia.com, and this video deals with gaps in the currency market. A gap is forming often on the stock market, as the cash opens with a gap almost daily. It is not the same in the FX market, as it is a 24/5 market, meaning that it is open from Monday to Friday and the only possibility to have a gap is over the weekend or at the Monday’s opening price.
Impact from the Recent Events
Over the weekend things happen, like elections, referendums, or central bankers deciding something, etc., a natural disaster like a tsunami, a storm – whatever that may have an economic impact and may affect prices at the opening will create a gap.
Empty Space on a Chart
A gap represents the empty space on a chart. On the currency market, a gap is difficult to be seen because of the high liquidity. For instance, when important news comes out, like the NFP in the U.S., or the Fed issues the FOMC Statement every six weeks, you may see a gap forming on the five-minute or hourly chart. As all trading algorithms buy or sell using the same reasoning – if the data beats expectations or not. Because everyone trades in the same direction, and that causes small gaps on lower timeframes. But on the bigger timeframes are not possible to form.
The beauty of gaps is that they are visible on all timeframes. This is the closing price on Friday and the opening on Monday – the timeframe does not matter, as the gap remains the same.
How to Interpret a Gap
There are to ways to interpret a gap. One way is the so-called Western approach and the other is the Japanese approach. On the Western approach, you need to measure the gap (the empty space between the closing and opening prices). There is a controversy here, because the closing price here is a bit lower avoiding the upper shadow, and the opening this one here. What is the true gap?
The Western approach is that this is the real gap, like this, and the market should come and close it on the same day, or at least on the same week. Often this happens, but sometimes gaps remain open for quite a long time, stretching investors.
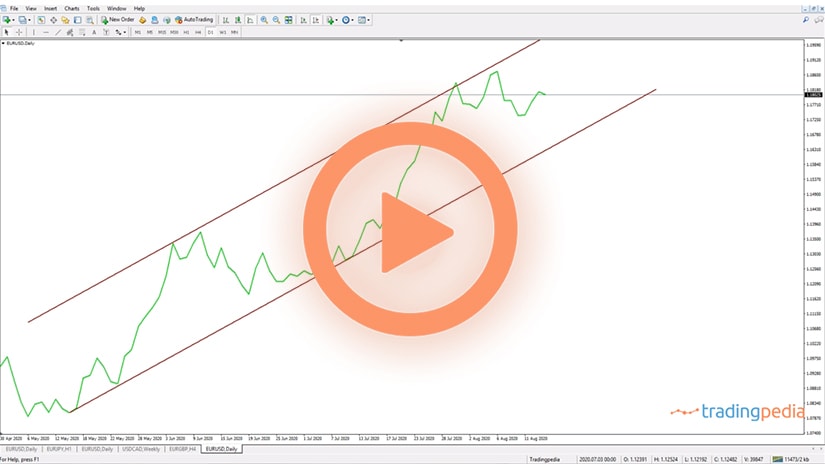
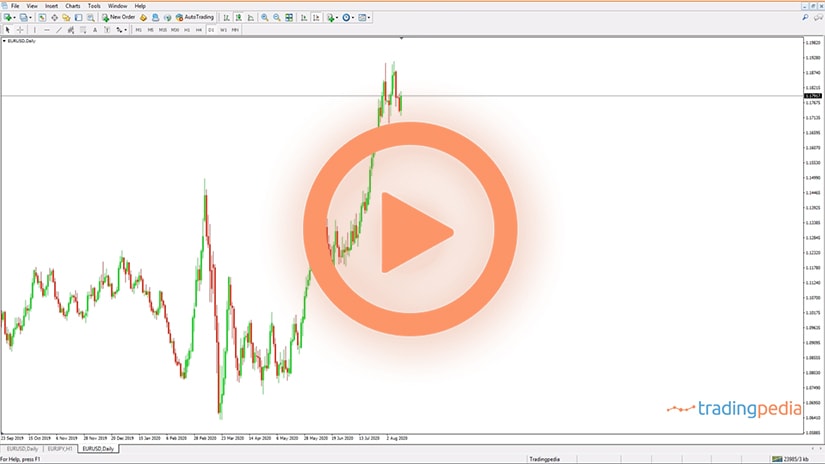
This is the EURUSD 4h chart, and this is the so-called Macron gap, in 2017, formed when the French elections happened over the weekend. Macron won, he was viewed as a pro-European President, and the market viewed it bullish and gaped higher. But the gap remained open – the market did not fill the gap, not that day, week, or month, as it kept moving higher and higher. From the 1.09 level, the opening price on that Monday, it did not stop all the way to 1.25.
Trading gaps under the Western approach requires to remain short all this time or at least one trading week.
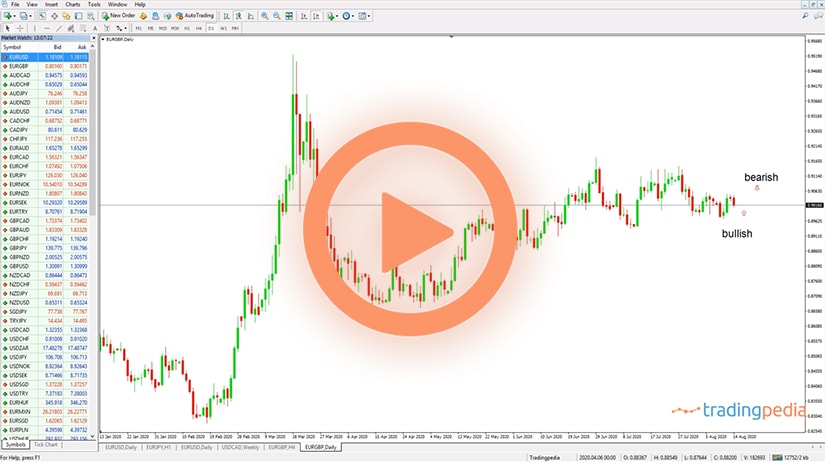
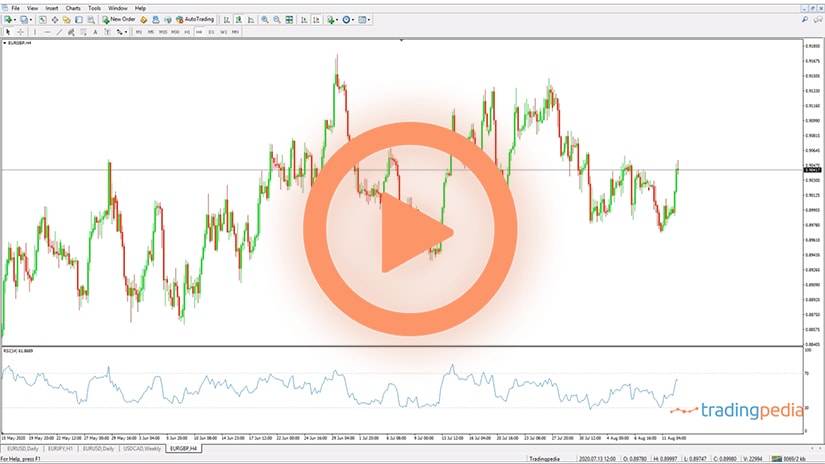
Under the Japanese approach we should measure only the empty space seen on the chart. The bigger the gap, the better for the Japanese approach. The Japanese call gaps windows and they refer to gaps as continuation patterns. It means that if the market is in a rising trend, a window appeared, and the market should continue in the same direction. Moreover, the edges of a gap act as strong horizontal support or resistance levels. They change roles – support turns into resistance and resistance into support.
Bullish Window
If we zoom out a bit, we see that the market broke this bullish window, retested the upper edge of the window, that acted as a support, and never looked back from that moment on. Another advantage when treating gaps is that the support and resistance levels remain on the chart from that moment on. So from 2017 we know that the EURUSD has a horizontal support between 1.0838 or 1.0730, approximately 100 pips range. So by the time that it reached 1.25, it began falling and at one point in time, ahead of the coronavirus crisis in 2020, it reached the upper edge of the gap. Remember that it represents support, and the price bounced almost vertical to 1.15, and then the pandemic reached the Western world. The other edge of the window acted as support, and then all the area acted as support, and eventually the price was rejected from the gap to the current level.
Related Videos
Sum Up
To sum up, both approaches were right. The Western approach requires that the price closes the gap. It did not close it on that day or week, but it did so many years later. The Japanese approach requires that the edges of the gap act as support or resistance. So far, the support held on three attempts. Especially, the gap helped finding the bottom after months of consolidation, and all that time the EURUSD traded with a bearish tone.
So it is useful when we can put a technical reason behind the gaps – treating gaps is one of the best ways to find support and resistance and then to couple it with some economic news. In this case, Europe announced the Recovery Fund and the joint debt issuance sent the EURUSD higher, but it bounced from the support given by the gap.
This is how to trade gaps in the currency markets. Have a great day. Bye bye.