
Hello there this is tradingpedia.com and this is a video guide of the MetaTrader. This is the MT4 – there are two versions, 4 and 5. Out of the two, the MT4 is the most popular one, being used by more traders around the world. The MT5 has all the MT4 capabilities and more, in the sense that you are forced to use the FIFO order (First In First Out) and hedging is not allowed, introduced due to the restrictions in some markets like the United States market.
How To Use It
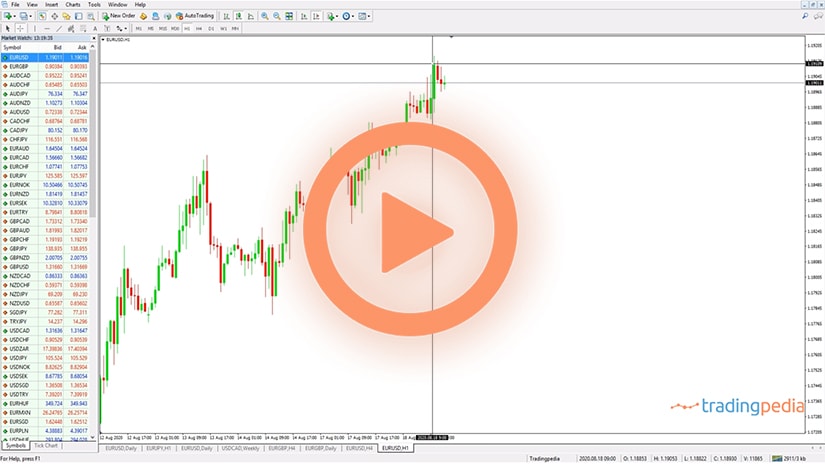
 Coming back to the MT4, you can customize a chart by choosing a currency pair from the MarketWatch. If you have here only a few currency pairs and you want to see more, you just need to make a right-click on any currency pair, click Show All, and the entire broker’s offering appears on this window. If you select then New Order from this window, you can change the volume to trade and can participate in the market by selling from the bid or buying from the ask price.
If you want to add a new chart on the MT4, you select a new currency pair, then choose Chart Window, and a new chart opens, in this case on the EURUSD pair. Or, you have another option, go to File, New Chart, and you select a market, like the EURUSD, and you select a new chart.
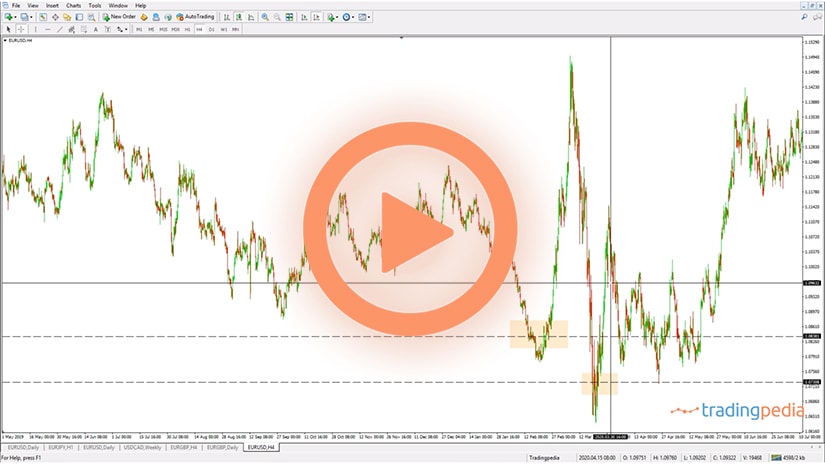
All charts are open here on the lower side of the screen and you can switch between two different timeframes for instance to see how the market evolves on the bigger and lower timeframe.
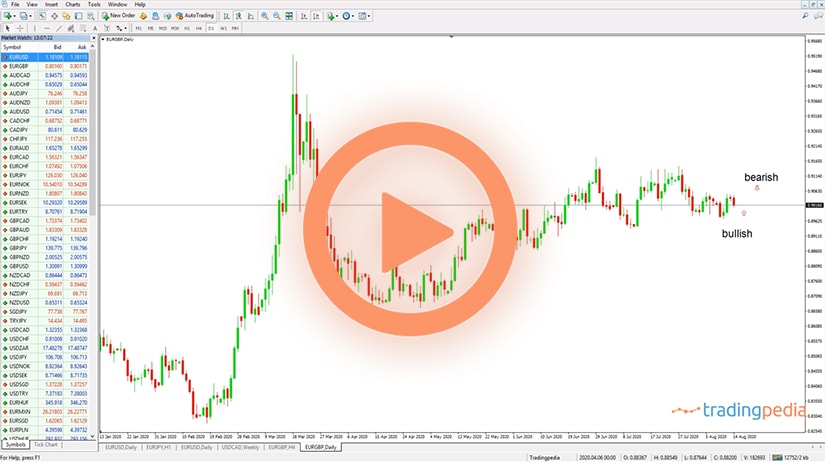
This is the EURUSD 1h chart and it shows all the recent price action on the pair but it is a bit rough – you need to “play” a bit with it and edit it in such a way to use its features as much as possible. To do that, just make a right-click anywhere on the chart, then select Properties and here we can play a bit with the colors, levels, etc. For instance, we start with the colors. We can change the background, a bullish or a bar up means green usually, bar down is associated with a red move, or bearish, bullish candlestick green, bearish candlestick red. The foreground – we cannot leave it white because combined with the background’s color we won’t be able to see it so we change it to black. Next, click OK and this is how the chart looks.
Obviously, you may not be happy with this outcome, and there are more setting to be done. For instance, make a right-click again, go on Properties and Common Tab, and we see that this is a bar chart, but maybe we want a candlesticks chart. We do not want to see the OHLC, which stands for Open High Low Close, because the MetaTrader4 already shows them here on the bottom right of the screen. I usually do not use the Show Grid option because it makes it difficult to see the actual prices.
The chart Autoscroll option is very important and you want to make sure you deselect this option. If you want to do some analysis using historical prices you will have a hard time because every time you will do that the market will come to the current price. Therefore, you deselect chart Autoscroll and select Chart Shift, click OK, and this is how the chart looks like.
If you want to change the background, or only the background, you can change it very easily like that. If you want to zoom in, you can zoom in and better see the candlesticks. Also, if you want more space on the right side of the chart for your analysis, if you see this small grey arrow, you can click on it, select it and drag it in the middle of the chart, like this. This way, every time you will analyze a market and move the chart with click and drag, you will still have plenty of room and space on the right side of the chart to write, to do a price forecast, whatever.
AutoTrading
 Another important feature is AutoTrading. If you click here, it enables automated trading. You can import your expert advisor, or trading algorithm, and you can apply it by click and dragging on a chart. You will see a small smiley have on the top right side of the screen and when you instruct the robot to trade, the face will smile, showing that everything is ok with the expert advisor. If something is wrong, it will not smile anymore, meaning that the expert advisor will not take any trade.
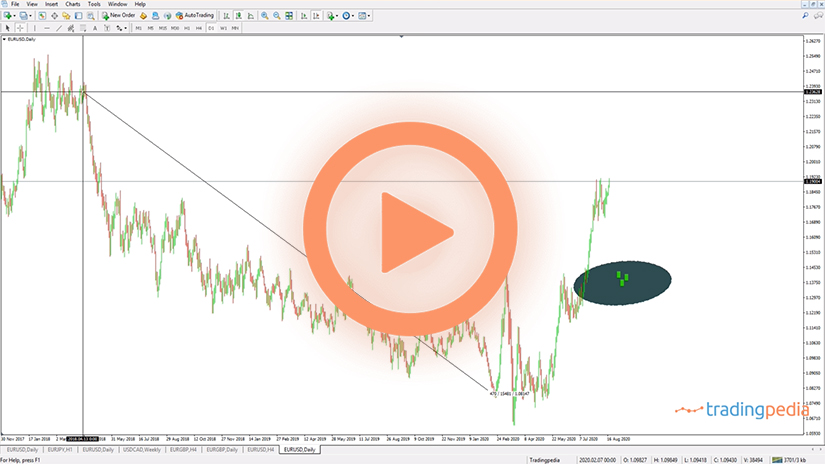
This is where you can switch to various timeframes. If you want to write on a chart, do not use the Draw Text Label but use the Draw Text only, because if you use the first one and you type something like this and you change the timeframe, the text won’t be visible on all the timeframes and will change position. This is very important when counting waves with the Elliott Waves Theory, for example. Therefore, if you want that the text remains where you put it, let’s say that this is the fifth wave of an impulsive move, you can put it here, select it, and the text will remain on the screen.
Technical Analysis
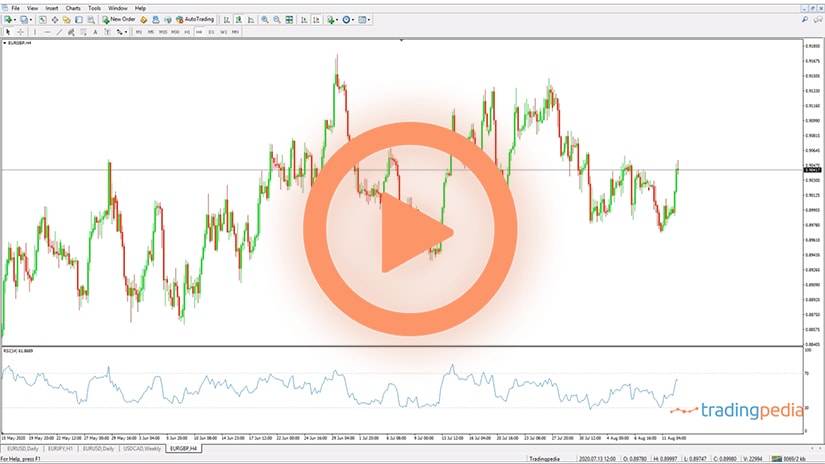
 Another features to consider belong to technical analysis. The MetaTrader4 has various features built-in, coming with the default settings. They are being split in oscillators and trade indicators, but also volume indicators, Bill Williams, etc. We will have a closer look at them later.
At this point in time, it is important to remember that this is how you select an indicator, in this case the DeMarker, and if you click OK, it will be applied on the screen.
Fibonacci Tool
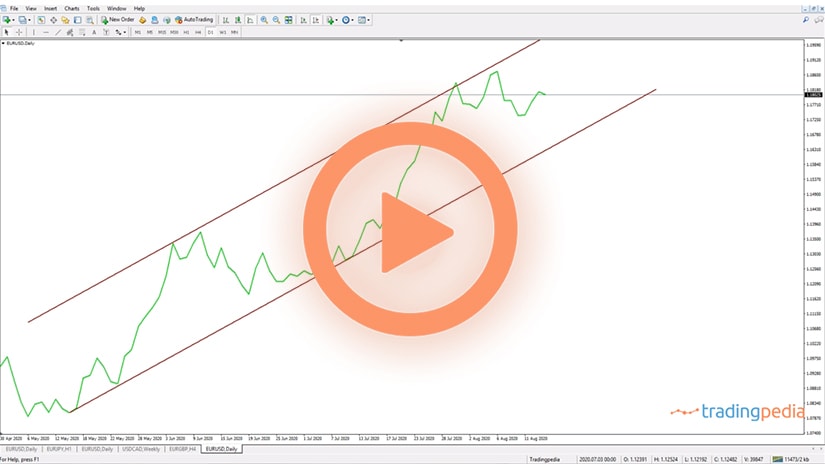
 The MT4 also offers all the Fibonacci tools, trends and trendlines, and there is even a shortcut for them. You can simply draw a trendline like this, you click on it, and define the trend on the EURUSD to the upside.
On a trendline you can edit it by double-clicking on it or making a right-click after selecting it, and then you go on the parameters and make sure that the Ray is not selected.
Related Videos
If you push down the CTRL tab on your keyboard and you select an object and drag it, you basically copy that object. Just push down the CTRL tab, select it, drag, and that is it.
By the time you are happy with the settings, just make a right-click, go on the Templates, and save it, and the next time you do not need to make all these changes when opening a chart.
Tips and Tricks on Using the MT4 Platform
 The MetaTrader4 or the MT4 platform is far more versatile than its sister, the MT5. Think of all the differences between the two, as presented earlier in this article, and the fact that they exist only due to regulation.
More precisely, MT5 is a better platform for managing risk. However, the MT4 has similar capabilities, only that it does constrain the trader’s actions.
Further to everything presented so far in the article, this section covers some additional tips and tricks to consider when using the MT4 platform. As such, we will look at how to make a chart “user friendly” for the trader, how to import historical data, and how to use the Strategy Tester section.
Transforming a Chart on the MT4
 When opening a chart in the MT4 platform, the default settings are not “friendly” at all. To make the most of a chart, the trader must change the settings.
Moreover, at the end of the process, the trader has the possibility of saving a new profile. Therefore, next time when any chart is opened, the new profile stands ready to being used.
A chart’s customization goes beyond just changing the background, colors, or the type of chart. By right-clicking on a chart, choosing Properties, and selecting the Common tab, the following box appears on the screen.

Still, from this box, one may shift between the three main types of charts – bar, candlesticks, line. That is pretty much all it can be done from the top-right of the window.
The most interesting setups come from the top left and bottom-right areas. Let’s consider them separately.
The top-left area has the Chart Autoscroll option selected by default. For technical traders, that is a nightmare to deal with.
Because technical analysis considers historical prices in order to project future levels, the need arises to study past prices. Yet, if the Autoscroll option is checked, the chart will constantly come back to the present market levels.
To avoid this, traders must un-select the Autoscroll option and select the Chart shift one. This way, the chart is free to shift anywhere to the past data, providing the data is available on the trading platform.
On the bottom right corner, the Show grid option comes with the default settings. However, when building technical analysis studies on a chart, traders may want to avoid the grid lines as the chart becomes too crowded.
How to Import Historical Data on the MT4 Platform
 For traders that use a top/down analysis approach in their market analysis, historical data is key. Yet, if one checks historical price data on the main currency pairs, she will find that there is limited data available to interpret.
The best example comes from the GBPUSD pair. Most MT4 platforms offer the GBPUSD price data only from 1997 or so. But a quick research over the Internet reveals the fact that both currencies, the U.S. dollar, and the British pound, existed well before 1997. Hence, there must be more to the historical data that the MT4 platform offers with the default setting.
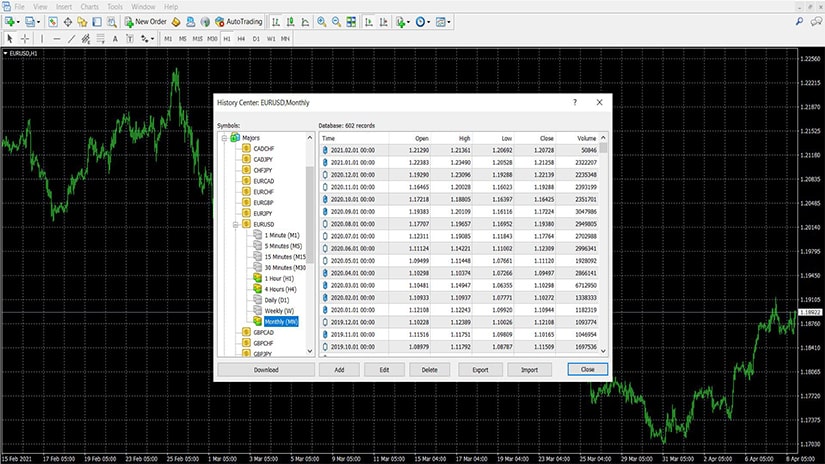
To solve for this issue, traders must follow two steps. First, traders should use the available data that is not downloaded on the local platform yet.
In the History Center that can be found under the Tools tab from the main menu, traders may download additional data, providing it is available. To do so, make sure you select the currency pair and then, from the monthly tab, download it on the platform. If there is more available, it will start uploading. If not, traders may consider the second step.
The second step refers to importing data to the platform. To do so, the trader must have the data saved on the computer in an appropriate format – one that is compatible with the one used by the MT4 platform. The platform allows importing as much data as possible, although the trader should be aware that historical data is difficult to find.
How to Use the Strategy Tester on the MT4 Platform
 The Strategy Tester does just like its name suggests – it allows traders to test automatic strategies against historical data. Doing it so manually is not feasible, and the Strategy Tester does a great job proving if the system is profitable or not based on the past data.
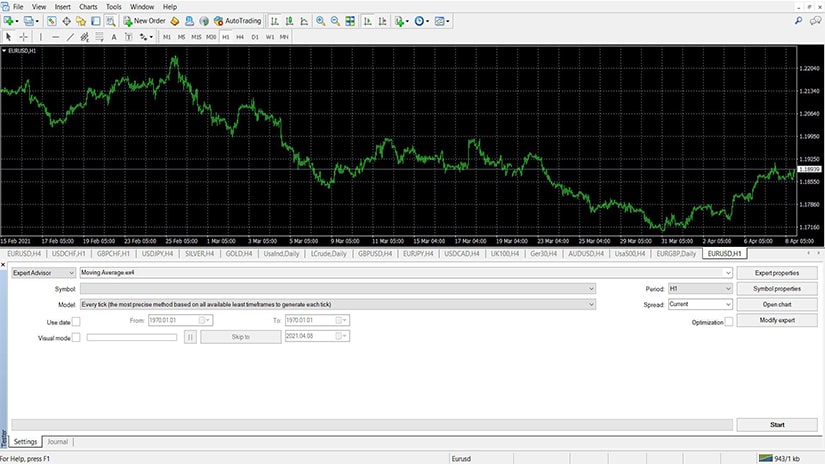
The trader may select the period to run the strategy, the timeframe, and may alter the attributes of the testing in many different ways. It should be noted here that the most accurate back-testing is done by using tick data. Here’s why.
MT4 platforms differ between brokers. Because various brokers have different trading conditions in terms of the spread, etc., the data, especially on lower timeframes, differs.
Most of the automated trading strategies are built on the lower timeframes, such as the 1-minute or the 5-minute charts. As such, these strategies are susceptible to delivering different results on different brokers. It may be that on one broker, a strategy is profitable, and on another is not making a dime.
To sum up, the MT4 platform has all the capabilities of the MT5 platform and some more. Despite their simplistic look the MT4 platforms are extremely competitive.
In fact, it is exactly its simplicity and ease of use that make it so competitive. After all, it is the most popular trading platform for the retail trading community, and it literally has no rival.
Competition does exist, but it comes with nothing new when compared to the MT4. If anything, traders must learn new features and new ways to use a platform when all brokers offer the MT4 for free anyways.
Also, its popularity makes it easy to switch between brokers. Traders may simple save the profiles on their computers and upload them on the new MT4 platform offered by the new broker.
All of the above make the MT4 platform difficult to be replaced currently. As such, expect its reign to continue in the years to come.