
Hello there, this is tradingpedia.com and this video deals with how to trade with the Stochastic oscillator – a popular oscillator, available on all trading platforms, this being the MetaTrader.
How to Use The Stochastic Oscillator
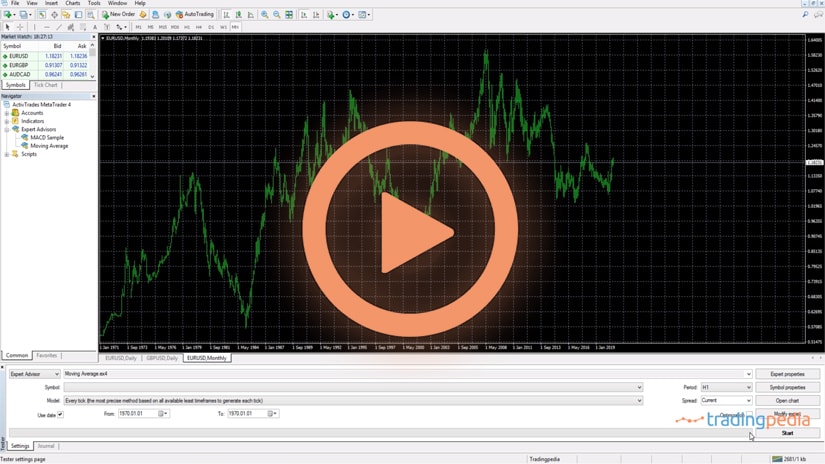
You can find it under the Insert/Indicators/Oscillator. It comes with the default settings in all trading platforms. It is one of the oldest oscillators and it has the advantage of being extremely visible, telling traders effectively where to go long or short.
It can be used both on the stock, currency or commodity markets. Whenever there is a chart, the oscillator helps.
Stochastics appears in a smaller window, below the main chart, and you can choose to interpret only the oscillator moves. It keeps you on check regarding where the market may go.
It travels only in positive territory as it has values from zero to one hundred, meaning it cannot exceed 100, as it cannot fall below the zero level.
Overbought and Oversold
Like many oscillators, it has an overbought and oversold area and traders try to sell overbought and buy oversold. This works well in ranging markets, but if the market is not in a range, you will have a hard time trading with overbought and oversold levels.
The best way to use the Stochastics is to interpret the signal line. As you can see, it has two lines – the blue line and the small dotted line (the fast Stochastics). In a bullish trend you look for the fastest line to move below the slowest one, and in a bearish trend you look for the fastest line to move below the slowest one.
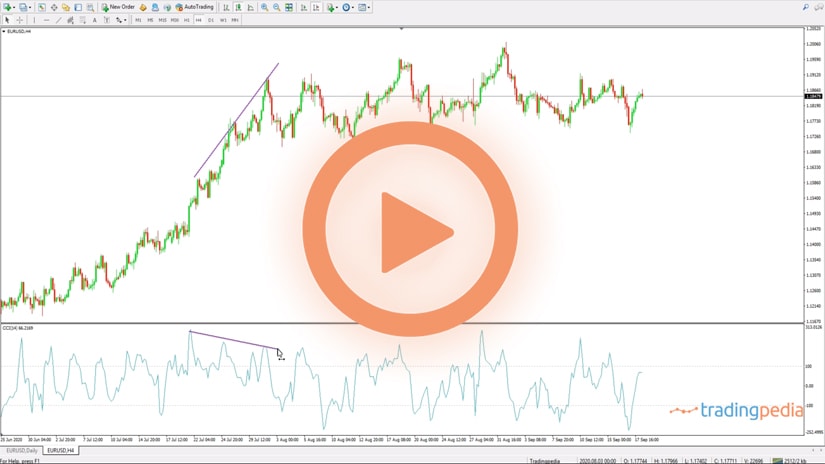
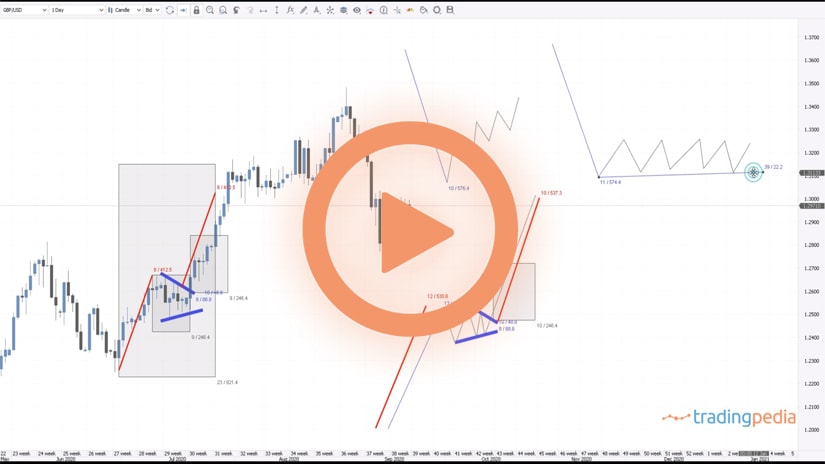
Besides overbought and oversold, traders also wait for the Stochastics to reach overbought and when the fastest line crosses above the main line, that is a bearish sign into overbought area, so you want to go short. This worked very well on the EURGBP 4h chart, because the market broke higher, and then it declined.
The same thing it did here. If you bought it here into oversold, the signal line showed a bullish sign, but the market kept declining. That is the standard interpretation, but it doesn’t work that well because one of the drawdowns of this oscillator is that it reaches very often overbought and oversold territory.
A great way to trade with this oscillator is to use signals given by the Stochastics when the signals appear between overbought or oversold levels. In other words, the focus should not be at overbought and oversold levels, but between 80 and 20. How come?
There are two approaches. One is that we build the 50 level, half of the distance between 20 and 80 and every time the Stochastics crosses the level on the upside or downside, we go long or short. To avoid moves like hits one here, for example, traders switch to a lower timeframe, like the hourly or lower, and then will scalp their way with a bigger volume.
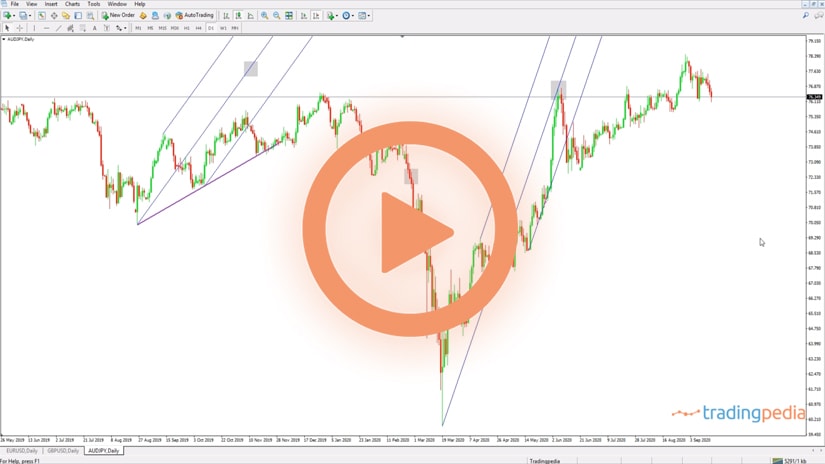
Another way to trade it is to focus on this area between 20 and 80 and use the rules of a trend. When the market is in a bullish trend, you focus on it making higher highs and higher lows. For instance, when the market reversed, it formed a high, then a higher low, and then another higher high, telling us that a new trend is about to start. But when to go long?
We use the oscillator as it offers a bearish sign into the overbought, starts a move lower for a few hours, and then offers a bullish signal while between 80 and 20. That is a signal to go on the long side.
Any bullish or bearish trend will have periods of consolidation, when the market catches its breath. By the time the trend resumes, you want to be there to make the most of it.
As long as the trending conditions remain in place and the rules as well, this is what the strategy involves. So, the market advanced, it made another higher high, and another higher low, even forming a continuation pattern.
The Stochastics showed a bearish, and then a bullish one between the 80 and 20 – another signal. Then the market moves higher, forms a bearish signal as well, but on this move lower the Stochastics does not offer another bullish entry as the slowest line reached the oversold so it does not fit as a signal.
This is not a bearish signal because the slow Stochastic was strong enough to reach overbought. And then the market reached higher and the series of higher lows was broken here. When the market moved again, if it continues, a selling signal may appear. You may see the same thing here – this is a bearish trend, and then shorting the pair here it makes sense.
Related Videos
Conclusion
In other words, when you trade with the Stochastics, and with any other indicator as a matter of fact, try to keep an open mind and “play a bit with it and customize it to gain a competitive advantage against the market and other traders.
Thank you for being here and have a great day. Bye, bye.