
Hello there, this is tradingpedia.com and this video deals with two classic technical analysis patterns. Classic because they belong to the Western world part of technical analysis, developed on the stock market back in time and they work on any market or timeframe you want to use in trading.
Overview
 We talk today about flags and pennants. These are continuation patterns, meaning that if you have a trend, sometimes in the middle of the trend you will have a continuation pattern. It means that the market consolidates for a while, builds energy before continuing in the same direction.
The consolidation area or the continuation pattern may be cause by various factors. For example, an interest rate announcement, or some key economic data like the Non-Farm Payrolls in the United States or the Unemployment Rate in the United Kingdom, and so on. Or, simply the market waits for more liquidity as there is a bank holiday in one of the important centers – it depends.
What Is a Pennant
 A pennant looks like this. You have a bullish trend, and then the market, at one point in time, consolidates, forms a triangular pattern, but a triangle that does not take much time. Next, the trend resumes. A pennant is easily visible if you connect the edges of the triangle and it has a measured move equal with the distance from the start of the trend until the pennant.
This is the measured move, we copy and project it from the end of the triangular pattern. However, more important, in a pennant, the measured move must come in less than the time it took the consolidation to form. We simply measure the consolidation and project it on the right side of the chart and the measured move must come before the time expires.
If time expires, you book your profits. If you don’t get out, at least book half of the profits and move the stop at breakeven because the pennant was not confirmed by the future price action. A pennant is a very powerful formation in the sense that the consolidation takes a short time. It is not a long-term consolidation, so when it pops it should reach the measure move in a jiffy.
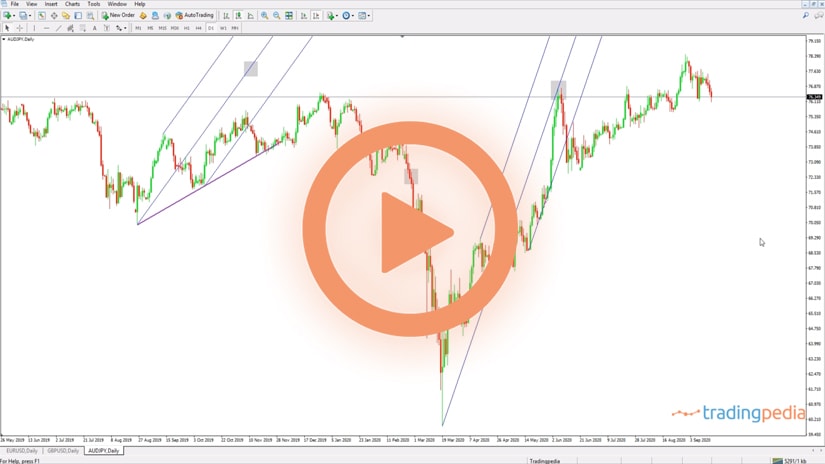
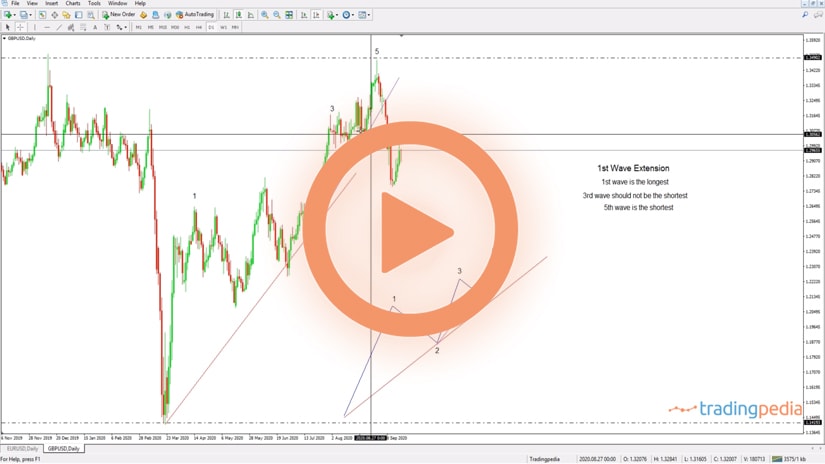
This is the GBPUSD daily chart and each candlestick represents one day. The market formed the pennant here and if we use the principles discussed so far, we mark the consolidation and the edges of the triangle, this is the pennant. Next, we find the measured move and project it from the end of the pennant and project the time element on the right side. The measured move should come in less than this time. Because it did, the entire pattern is valid. This is a continuation pattern and all the rules are respected.
Related Videos
What Are Bullish and Bearish Flags
 Besides pennants, the market also forms bullish and bearish flags. In a bearish flag, a falling trend must exist and then the market consolidates. Careful here – a pennant consolidates on the horizontal, but a bullish flag may consolidate on the horizontal or against the main trend. So if this would be your trend, a bullish flag may also consolidate like that, in the opposite direction of the trend.
The difference between flags and pennants is that flags take much more time than pennants. If we mark the edges of the flag, we need to follow the same principles. We find the measured move and project it from the moment the flag breaks lower. The time element also applies, but between the two, the time element is far more important on the pennant rather than on the flag. The explanation comes from the long-term consolidation that makes the pattern visible – everyone sees it. But in the case of a pennant, the time is shorter so the people may not notice it. Between the two, again, pennants are more aggressive.
Pennants are more aggressive. They form during rising and falling trends and the time element plays an important role. In a pennant, the consolidation takes less time than in a flag, and the pennant forms on the horizontal, while flags form on the horizontal or against the original trend. Also, the measured move represents the move until the consolidation projected from the breakout point.
How to Trade Pennants and Flags
 Pennants and flags are continuation patterns. They form in strong trends, and the price action simply builds energy to reach a higher or lower level.
Both patterns can be bullish or bearish, although bearish pennants do not form that often as bearish flags. The conditions to trade them are similar, and this article will focus on bullish continuation patterns.
If we compare the two patterns, some distinctions must be made. Although they are traded in a similar fashion, each pattern has some particularities worth noting.
To start with, flags appear more often than pennants. Much more often.
But pennant formations show a more aggressive market. More precisely, the price action during a pennant’s formation is so strong that there are little or no pullbacks.
Another thing to consider is the shape of the two patterns – one is a triangle, typically a symmetrical one (pennant), and the other one is most of the times a horizontal consolidation area other than a triangle (flag).
They do have many things in common, such as how to determine the measured move that follows the breakout. Also, the interpretation of the time element in the analysis is part of both a flag’s and a pennant’s interpretation.
Flags and pennants tend to form ahead of important economic releases or confluence areas difficult to break from a technical analysis point of view. For instance, right before the release of a major economic report, such as the Non-Farm Payrolls in the United States, the market may consolidate, waiting for the actual data to resume the previous trend.
Trading a Flag
 Flags are tricky to trade. They came in two shapes and forms – horizontal and against the main trend.
The easiest types of flags to trade are the horizontal ones. Such a flag is characterized by a strong, almost vertical market movement, followed by a tight range that forms on the horizontal.
Literally, the market finds resistance (in a bullish flag) at a horizontal area and builds energy for a breakout. This type of a flag is the easiest one to trade and interpret.
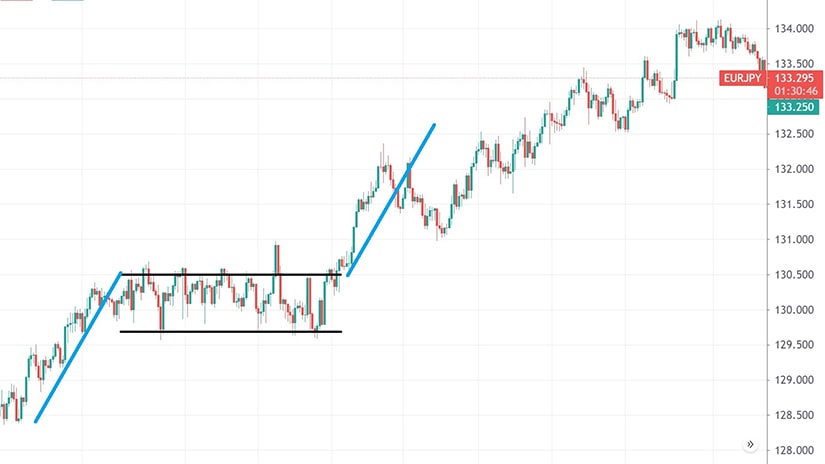
The 4h EURJPY chart seen below reveals a bullish flag forming on the recent bullish trend. The market advanced from the 128 area to the 130 area where it found it difficult to keep rising.
Bears tried to push the price back, but all they achieved was a horizontal consolidation at the round 130 level. The move prior to the horizontal consolidation, called the flagpole, serves as the flag’s measured move. Projected from the upper edge or a horizontal consolidation bullish flag, or from the breakout point, the flagpole determines the minimum distance that the market needs to travel to confirm the pattern.
Flags Forming Against the Main Trend
 The other type of flag is more difficult to interpret and trade. One of the problems with trading flags is that there is no time limit for the consolidation. In other words, the market may take quite a while before breaking out and often forms false breakouts.
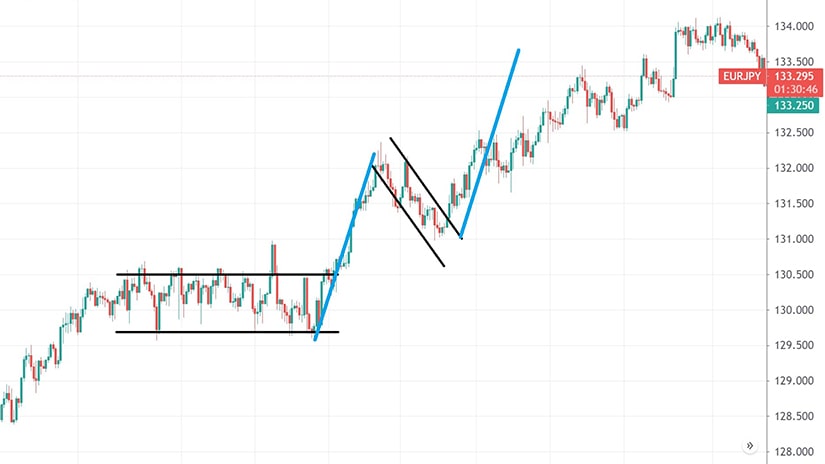
To add to this issue, a flag that goes against the trend may retrace a significant portion of the flagpole. In some cases, although rarely, it may retrace even more than 61.8% of the flagpole’s length.
Such a flag formed on the same EURJPY cross pair. In fact, the flagpole formed right after the market broke from the previous horizontal consolidation. Note the difference between the two patterns, and you’ll see why the latter one is more difficult to trade and interpret.
Rules to Trade a Bullish Flag
- Measure the flagpole
- Define the consolidation area
- Projected the flagpole’s distance from the breakout point
- Time rule
- Measure the time it took the flag to consolidate
- The future price action must reach the measured move in less than the time it took the flag to form
Trading a Pennant
 A pennant is similar to a bullish flag formation in the sense that the move prior to the pennant’s formation is equally aggressive. Also, the measured move is calculated and projected the same way as when trading a bullish flag.
Yet, the pennant does have some particularities. First, the consolidation area is a symmetrical triangle. The triangle does not allow for deep retracements, so the price action always remains bullish.
Second, a pennant rarely results in a false breakout. For this reason, the price action does not retest the upper edge of a bullish pennant, but simply goes for the measured move.
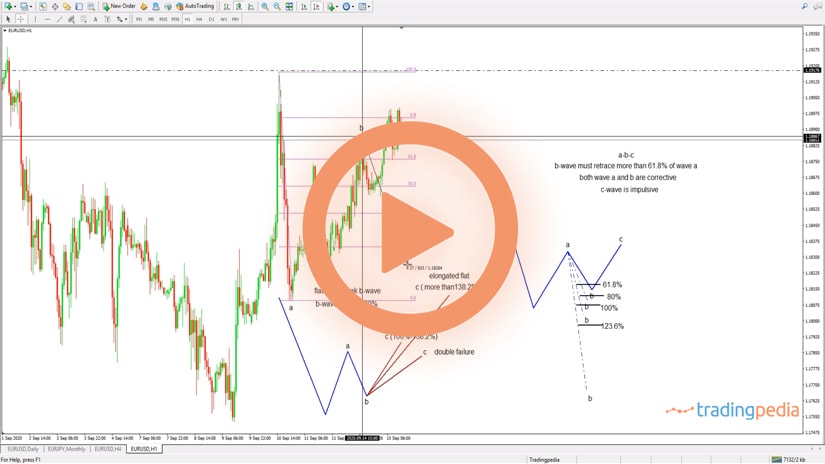
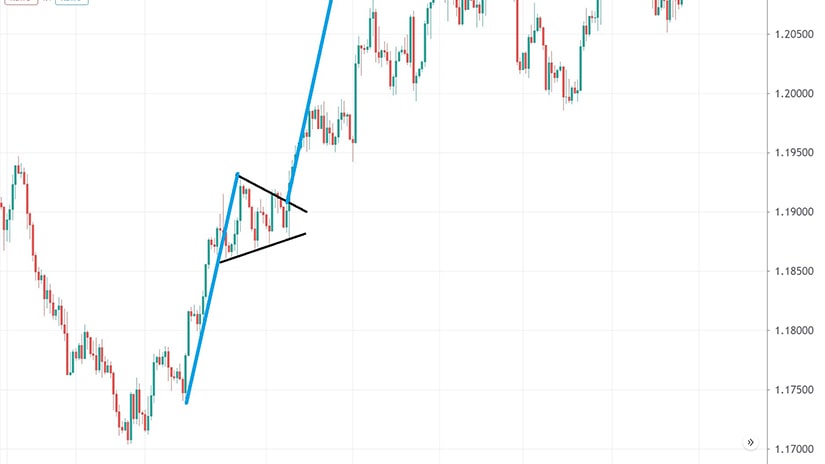
The EURUSD chart below shows a pennant formation formed on the recent bullish trend. The market reached the 1.19 area, consolidated for a little while before breaking higher. Focus on the breakout point – no retest of the upper trendline whatsoever.
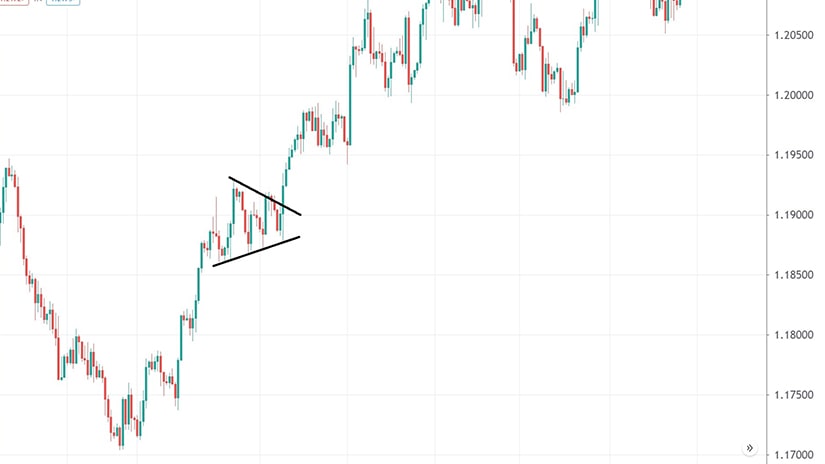
As mentioned earlier, the measured move is calculated similarly as in the case of a flag. The flagpole’s distance is projected from the breakout point and traders place a stop-loss order at the lowest point in the pennant’s formation.
The trading setups offered by flags and pennants result in a risk-reward ratio that is extremely attractive. A minimum risk-reward ratio is 1:2, meaning that the reward (i.e., the distance from the entry to the take-profit level) exceeds the risk twice. The bigger the ratio, the more attractive the setup becomes. In the case of pennants and flags, it is often the case that the result ratios exceed 1:2, thus making them attractive to investors.
The final point to mention in this article is related to the time element used to analyze a pennant or a flag formation. In both cases, the price action that follows the consolidation should reach the measured move in less time.
However, as it is often the case, the market fails to reach the desired target in due time. When it happens, the pennant or flag was not confirmed, meaning that the trader should exit the market and close the position. Thus, the time element serves as confirmation for flags and pennants, keeping the trader alert and part of the money management system.