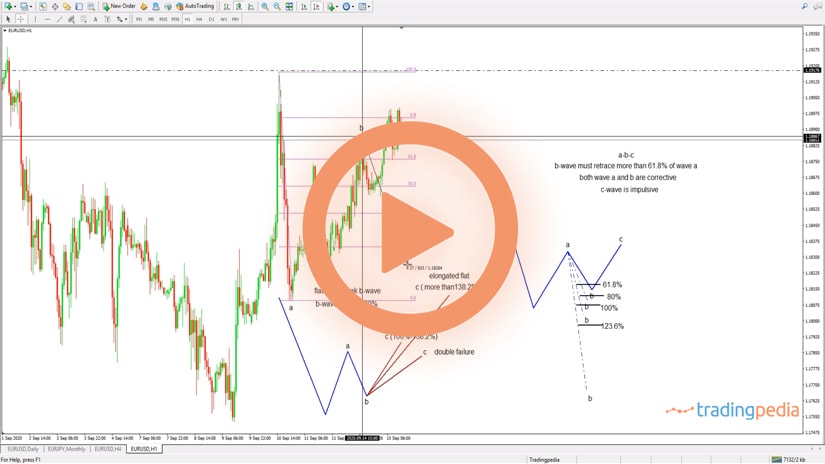
Hello there, this is tradingpedia.com and this video deals with Andrews’ Pitchfork – how to use this wonderful trading tool that comes with the default settings on the MT4. You can it under Insert/Andrews’ Pitchfork.
Overview
This is a concept developed by Dr. Andrews many years ago, and it evolved in time. The principles are very simple, if there is a bit of flexibility from the trader’s end. Namely, we talk about three parallel lines that start from the moment you apply the pivot points. The parallel lines define a trend and tell you where to enter and exit on a trend. This is very important.
An Example
Let’s use some examples. This is the AUDJPY pair on the daily chart and shows what happened recently. The key to understand Andrew’s Pitchfork is to understand the process of using the pivots. If you select the indicator, you will see here on the cross then number one, as the first pivot, then the second and the third. Finally, the pitchfork appears on the screen.
As you can see, you can use the Pitchfork and apply it on the chart in any way you want. However, the key is to find a strategy and the right positioning.
One solution comes from the rules of a trend – lower lows and lower highs in a bearish trend, higher highs and higher lows in a bullish trend. For instance, we see that the AUDJPY pair was in a bearish trend, and at one moment in time the market bounced, broke the series of lower highs, made a new higher low, so we have the three pivot points.
By choosing the pitchfork, the low is the first pivot, this is the second and here the third one. This is the Andrews’ Pitchfork – the most important line is the median line, the one in the middle, because it has the tendency to attract price. The inability of the price to reach the median line is a sign of weakness. There is also the Schiff line that connects the first with the last pivot and it tells you where the market turned from bullish to bearish.
In other words, we already knew that the previous trend was just a correction, as the pitchfork did not reach the median line. Next, the market broke the Schiff line. So, what to do next?
We apply the same principles, only this time on a bearish trend. We wait for the market to break the series of higher highs and higher lows. This one did not, but here it did. These are the three points for a bearish Pitchfork, and we apply it on the chart.
Remember, the price has the tendency to come to the median line. If it does so, it signals trending conditions. It bounces, hesitates, the line acts as dynamic resistance and then support, a great place for aggressive traders to go on the long side.
If we draw the Schiff line by connecting the first and the last pivot points, we see that the market breaks at this point, and we can apply a new Pitchfork, but after the market broke the Schiff line of the previous bearish pitchfork.
By applying the same steps, this is the resulting pitchfork. Again, remember that the price has the tendency to attract the price and by the time that the price did so, it confirms the bullish bias.
We can then draw the Schiff line and we see that the market broke it to the downside. The market made a new high, and if the market is able to break the series of higher lows, then we will apply the same steps all over again.
So on a simple chart we used the concept of a Pitchfork to find good trades in these uncertain times. You can do this on all the timeframes and all the currency pairs.
You can also use the 61.8% of a Pitchfork channel by using the Fibonacci retracement to find dynamic support and resistance levels. But these maybe some other time, not now.
Related Videos
Conclusion
For now, remember that pitchforks are wonderful tools in trend trending. That the median line has the tendency to attract price and that they work best with the series that define a trend. Also, the Schiff line invalidates the Pitchfork. Bye bye.
