
Hello there. This is tradingpedia.com and this video deals with the head and shoulders pattern, a reversal pattern that forms at the end of bullish trends. The opposite of the head and shoulders pattern is called the inversed head and shoulders pattern and forms at the end of bearish trends.
What is the Head And Shoulders Pattern
 The head and shoulders is a classic reversal pattern, or a Western reversal pattern, because it was discovered for the first time in the United States and still shows hesitation at higher levels, during bullish trends.
It has the following components. The market is in a rising trend, and all of a sudden it begins consolidating, a triangle, pennant, flag, etc. It builds energy to break higher and at one point the breakout comes towards the highest point in the head and shoulders. Nothing suggests that a reversal pattern forms. However, shortly after the market reverses sharply towards the same level of consolidation. At that place, another consolidation starts before the price breaks lower. This is the pattern and you may see that this is called the left shoulder, this one here is the right shoulder, so you know the name for the pattern, and the head represents the price action we see at the top of the pattern.
How to Trade the Head and Shoulders Pattern
 The pattern resembles the human body, and to trade it there are some steps to follow. There is one such thing called the neckline. This is a line that contains the price action on the two shoulders. Price stays here on the neckline before moving lower.
The pattern also has a measured move that equals the empty space from the candlesticks to the neckline, but make sure you have a 90 degree angle on the neckline. This is the minimum distance that the market follows. Also, conservative traders book profits by the time the market reaches 75% of the measured move and put the stop loss to breakeven and trailing it as the market moves forward.
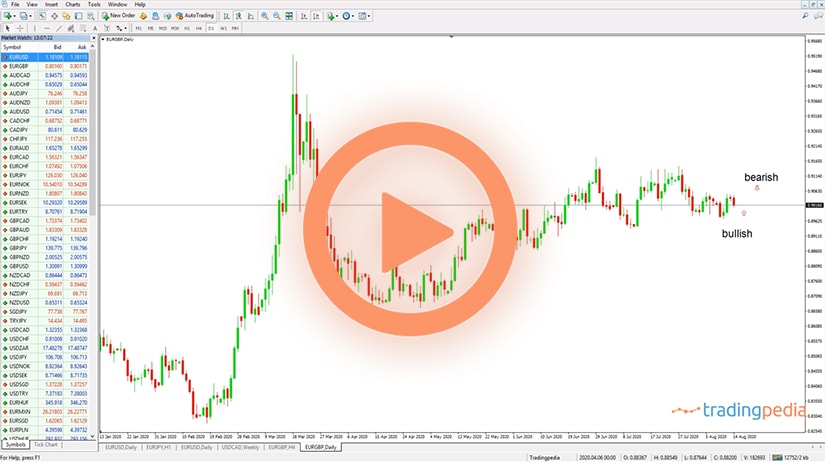
This is the theoretical concept. In reality, head and shoulders patterns are really ugly, especially on the currency market. Because the currency market reacts promptly to news, economic reports, etc., the patterns take various forms. For instance, this is the hourly EURJPY, and it June it formed a head and shoulders pattern.
The market was in a rising trend, formed a consolidation on the left shoulder, then it broke higher and quickly retraced towards the same level where the consolidation continued. This would be the right shoulder and for the neckline we connect the price action on the two shoulders, ideally you should connect only the real bodies and avoid the shadows. As you can see, this is already an ugly head and shoulders pattern – it does not look like in textbooks. For the measured move we measure the price action from the candlestick in the top of the head and then we use a 90 degree angle on the neckline. Finally, we project it from the breakout point.
The market broke the neckline and retests it, as it often happens. A conservative approach requires booking half profits at 75%, moving the stops to breakeven, and trailing the stop for the half position that remained open.
This might be a head and shoulders pattern as well. We see that the market moved higher, consolidated, spiked higher and came back to another consolidation area. We can easily do the same thing on the same currency pair with this being the left shoulder, this the right shoulder, the neckline looks something like this, and then when the market breaks lower, the measured move would be this one from here to here – the minimum distance that the market should have traveled. Did it travel it or not?
Related Videos
The price broke the neckline, it retested it two times and then went to the 75% of the distance mentioned earlier. So, conservative traders booked half the profits there, and the market retraced to the stop for the other half. Booking half on the conservative approach was the good decision, as sometimes these patterns do not work.
As a rule of thumb, the bigger the timeframe the pattern appears on, the less likely that the price will reach the full measured move because the pattern becomes obvious for all market participants.
Examples of Head and Shoulders Patterns
 The head and shoulders pattern belongs to the Western technical analysis approach. Among the classic patterns, it follows the price action closely, offering traders clues about a possible reversal.
Despite being a powerful reversal pattern, the head and shoulders has its drawdowns. One, for example, is the time it takes the pattern to form.
We know by now that the pattern has a head and two shoulders. While the head is characterized by quick price action, the consolidation in the two shoulders may take a lot of time. Compared to other patterns, this is a huge drawdown. To exemplify, think of the hammer or the evening star patterns – they are reversal patterns with only one, respectively, two candlesticks.
Another drawdown is its visibility. Because the head and shoulders pattern takes a lot of time to form, it becomes visible to market participants. By market participants, we should also consider trading algorithms that “scan” the charts for patterns like these. Therefore, the bigger the timeframe, the lower the chances that the pattern will work. Also, the more evident the pattern, the lower the chances that the market will reverse.
The examples presented here belong to various markets. As illustrated below, the head and shoulder is an ugly pattern, and the textbooks materials rarely depict a head and shoulders as it forms in today’s volatile financial markets.
Two more things to mention before looking at some examples. One is the neckline – it is not mandatory to be horizontal. In fact, most of the times, it is not. Another is the measured move. To make the most of it, try to look for a ninety-degree angle with the neckline. With these two conditions in mind, let’s have a look at some examples.
Silver – Two Consecutive Head and Shoulders Patterns
 The first couple of examples come from the silver market. The recent price action brought not once but two head and shoulders.
From left to right, the market first made an inverse head and shoulders pattern. This is a bullish pattern, and the neckline, depicted in black, is horizontal.
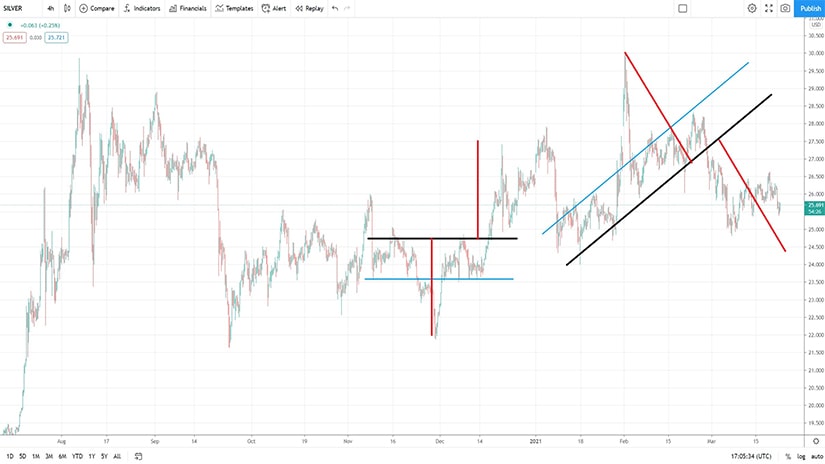
One thing that often happens, although it is not mandatory, is that the price in the right shoulder to find support on the projected neckline. Focus on the blue lines – these are the neckline’s projections over the lowest, respectively, the highest point in the left shoulder.
Conservative traders in search of competitive risk-reward ratios prefer to wait for the market to pull back to the projected neckline before going long or short. This way, they get a better risk-reward ratio, at the risk of missing the main move.
The idea is to use the measured move as the target for a trade. As such, it makes sense to wait for a pullback, as this is the only way to obtain a risk-reward ratio bigger than 1:1.
Out of the two patterns, the most interesting is the second one. Focus on the neckline, and the way the measured moved follows the ninety-degree rule explained at the start of the article.
GBPUSD – A Classic Head and Shoulders Pattern
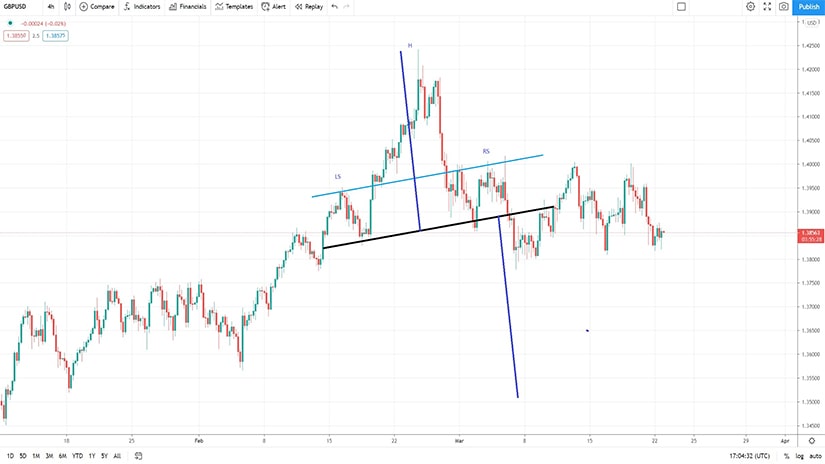
 The GBPUSD pair was on a bullish ride recently. In line with the move lower in the US dollar, the GBPUSD pair reached the 1.42 area after a steady rise that started in 2020.
However, it recently formed a head and shoulders pattern that typically appears at the end of bullish trends. Let’s follow the pattern using a step-by-step approach.
First, the market forms a continuation pattern as the left shoulder. At that point in time, no one knows what the market will form, if the bullish trend continues, or if a reversal pattern appears instead.
Second, the breakout higher to a new higher high was quickly reversed by a similar move. That is the first clue that a possible head and shoulders pattern may form.
At this point, traders may draw the neckline (the black line below) and use its projection to find out a better entry level (the blue line). For a trade to respect a proper money management setup, the bears need a stop at the highs and a target at the measured move.
EURUSD – A Failing Inverse Head and Shoulders Pattern
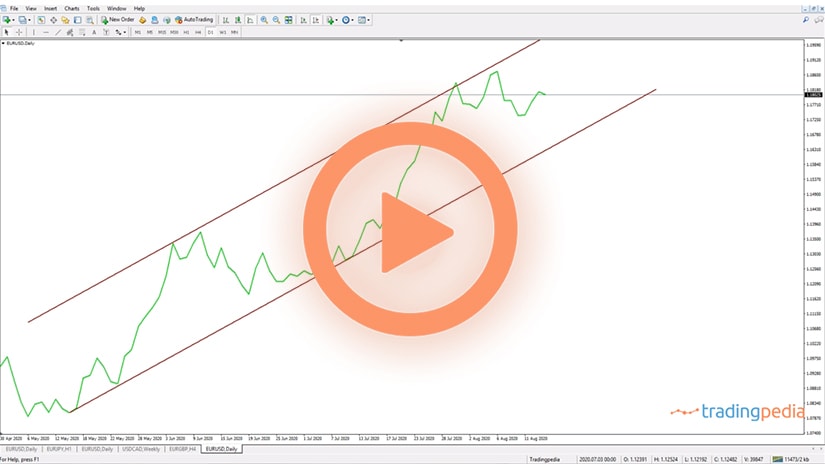
 The EURUSD pair made a new marginal high in 2021. Right at the start of this trading year, the pair reversed at 1.23 and did not look back until it reached below 1.20.
At that point, it formed an inverse head and shoulder pattern. By following the steps mentioned above, the trader may easily compute the risk-reward ratio and the levels required.
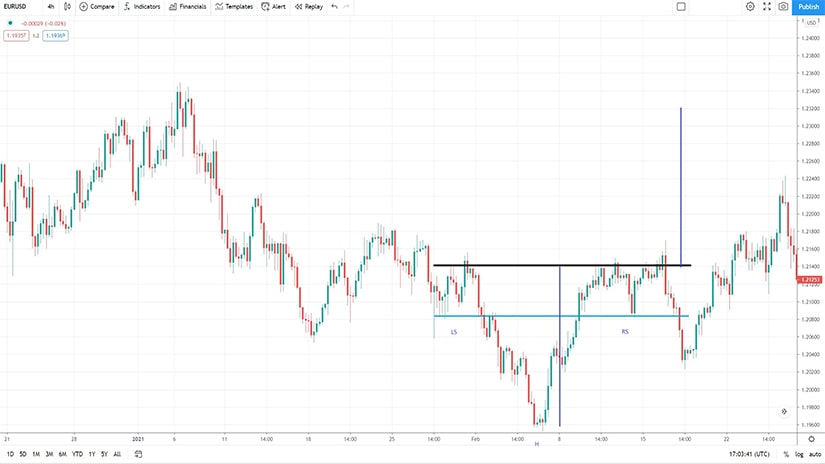
However, as we found out in the meantime, this head and shoulders pattern did not play out. In fact, the market reached half of the distance in the measured move and then reversed.
At the time of writing this article, the EURUSD trades at 1.1870 area, invalidating the pattern without reaching the measured move. As mentioned earlier, not all patterns survive, for the simple reason that trading algorithms scan the charts for situations like the one above.
Therefore, a money management system focused on higher risk-reward ratios, trailing stops, and close market-monitoring is key to successfully trading the head and shoulder pattern.
WTI Crude Oil Price – An Impressive Comeback
 Perhaps the most impressive chart of 2020 was the WTI decline and settled below the zero level. For the first time in history, a commodity futures contract settled in negative territory.
Unprepared, some brokers did not even show the move below zero on their charts. Because of the quick bounce from the lows, the market formed an inverse head and shoulders pattern.
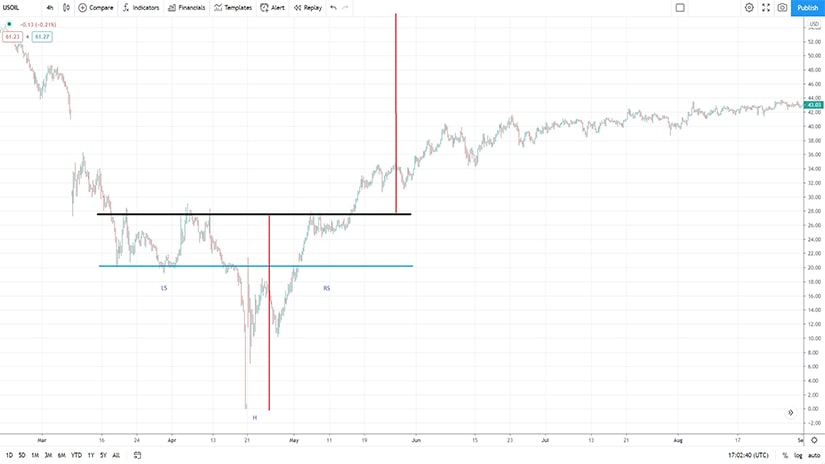
The difference here comes from the price action during the right shoulder’s formation. As the chart shows, the market did not pull back to the projected neckline. Hence, conservative traders on the lookout for such a pullback will have likely missed the entry.
The moral here is that the head and shoulders are strong reversal patterns, but they do fail from time to time. As always, money management rules are key for successful trading.