
Hello there, this is tradingpedia.com, and this video deals with correlations when trading financial markets, the currency markets, and not only. You have to remember that in a trading account there are other markets offered too, like stock indices, CFDs, etc., and they trade in a correlated manner. In this video I would like to introduce a few correlations to consider.
Trade Major Forex Pairs, or Minors
 To start with, consider the difference between majors and minors. They refer to currency pairs. Any currency pair that has the USD in its componence, e.g. EURUSD, USDJPY, USDCAD, is a major. The other ones are called minors.
Depending on the broker, you may see further differentiation between currency pairs. Some minors are called exotic currencies or exotic pairs, but this is the main difference between them – majors and minors.
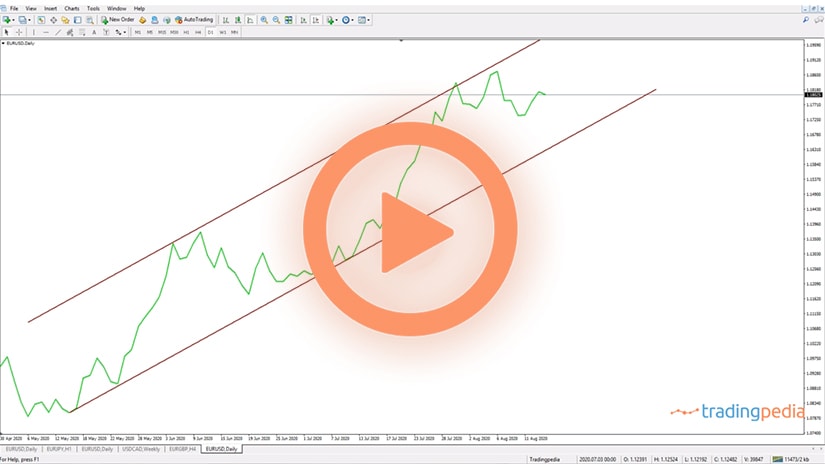
Minors are also called crosses, or cross pairs. These crosses have in their componence two currencies other than the USD and move on the differences on the two majors. For instance, this is the USDCAD weekly chart – a major pair. What would be a cross based on the CAD?
Let us say that this would be the NZDCAD if the other two major pairs, e.g. USDCAD and the NZDUSD, move in a similar manner, percentage wise, the cross remains flat. If the USDCAD rises 1% and NZDUSD falls 1%, the NZDCAD will not move. In other words, you can trade one of the three currency pairs based on the differences on the other two pairs. This is the most important correlation to consider when trading the currency market.
Risk-on/Risk-off Markets
 Another correlation to keep in mind is the risk-on/risk-off markets. So keep this in mind, as risk-on refers to the stock market that rises. Because the stock market is riskier than investing in fixed income products like bonds or notes, when investors move money into the stock market it is called risk-on. Traditionally risk-on moves on a higher stock market in the United States, e.g. Dow Jones, Nasdaq, S&P500. When they moved to the upside, investors used to borrow in JPY, because it had the lowest interest rate for decades, then they used the JPY proceeds to buy USD to pay for the stocks, creating a risk-on move. The Dow moved higher, USDJPY higher too, and the JPY pairs to the upside based on the direct correlation.
That changed lately as interest rates all over the world came to the zero level due to the Great Financial Crisis in 2008-2009, then the sovereign crisis in Europe with the Greece problems, then the ECB lowered the deposit facility below zero, so with low interest rates investors found different alternatives to the JPY. Nowadays, a risk-on move refers to the stocks moving higher, AUDUSD, EURUSD, GBPUSD higher too. This is an important correlation because if you believe that the market is on a risk-on move you should not trade all the currency pairs on the same direction. Trading the same volume on all pairs is like trading the same position on different markets – you end up overtrading and the slightest move against you will affect the trading account.
The opposite is true on a risk-off move – the stock market declines, gold to the downside, like it happened recently, the EURUSD, AUDUSD, fall, USDCAD rises, etc.
Related Videos
Commodity Markets
 Then are also correlations with the commodity markets. Commodity currencies react strongly to the market moves in the commodity they represent. For example, the Canadian dollar is strongly correlated to the price of oil. Canada has an energy intensive economy and a big part of its GDP depends on the price of oil. Changes in the price of oil affects the Canadian dollar and all the CAD pairs.
For example, this is what happened with the USDCAD in March and April when oil dipped into negative territory. If you remember, the futures contracts on the WTI in April with expiry in May had no buyers suddenly – it was no demand for oil due to economic lockdown. Therefore, it was no bid on the oil market, oil closed negative, the clearinghouse accepted that price, and that sent the CAD lower across the board – lower oil, lower CAD, higher USDCAD.
To make the most out of these correlations, especially the ones related to commodities, look at reports like the oil inventories in the United States as they affect the price of oil, OPEC meetings, etc. Anything that affects the price of oil has an impact on the Canadian dollar.
The price of oil has an impact on the currency market because oil is a big driver for inflation. Last but not least, consider oil and inflation correlation. How come?
Higher oil prices lead to higher inflation, higher inflation leads to central banks raising interest rates, higher interest rates are positive for a currency. End the opposite is true with a lower oil price.
Other Market Correlations A Trader Must Know
 So far, we have covered the relationship between majors and crosses, oil and the Canadian dollar, and the risk-on/risk-off environment. But in the world of financial markets, many other assets have different correlation levels.
Correlations are direct or inverse, and rarely are two markets 100% correlated. One example comes to mind, and even this was artificial, induced by central banks’ policies.
When the Swiss National Bank kept the EURCHF exchange rate at 1.20, the EURUSD and USDCHF inverse correlation got close to 100% the more the EURCHF came close to 1.20. But again, this was an artificial correlation that disappeared once the Swiss National Bank couldn’t hold the 1.20 floor. Yet, for a few years, it matters for the FX traders.
Other market correlations exist and add to the financial markets’ complexity. Such examples are the gold and the US 10-year yield, the oil and inflation, and the Australia – China economic dependency.
Gold-US 10-Year Yield
 Let’s start with gold. Investors like gold because it offers protection against inflation. When governments engage in currency debasement, investors find refuge in gold.
The price of gold reached an all-time high last year during the COVID-19 pandemic. Because the central banks around the world engaged in quantitative easing (i.e., bond-buying programs), fears of inflation sent the price of gold above $2,000 in the summer of 2020.
However, a close look at what happened after that invalidates the idea that inflation caused the spike higher in the price of gold. In the meantime, inflation rose from the lows, but the price of gold declined over $300 from its 2020 highs. How come?
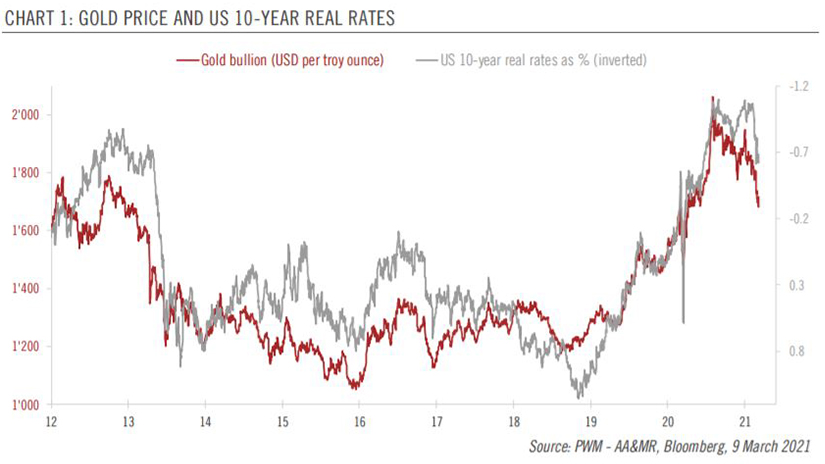
The explanation comes from the inverse relationship between the price of gold and the 10-year real rates. This is an inverse correlation, but quite a tight one, if we consider that the chart above shows the two assets’ correlation over the last decade.
Effectively, it means that when the yields decline, the gold price advances. And, the other way around – higher yields lead to lower gold prices.
This is precisely what happened in 2020 and 2021 so far. As long as central banks bought bonds, yields declined, and gold price made a new all-time high. However, as soon as yields bottomed, gold topped, and the two assets’ inverse correlation dominates the price action.
What is important to note here is that yields lead the gold market, and not the other way around. In other words, no matter how bullish one may be on the price of gold unless yields decline, the gold price will remain under pressure.
Oil-Inflation
 Another correlation that influences the price action in financial markets is the one between the price of oil and inflation. Because inflation is part of every central bank’s mandate, anticipating future inflation levels is key in setting the right monetary policy. Oil is a key driver of inflation, so the changes in the price of oil are monitored closely both by central bankers and by traders.
To exemplify, think of 2020 and what the pandemic triggered for the price of oil – it settled into negative territory one day in April 2020, closing close to -$40/barrel. Effectively, it showed that there was no storage left in the world for the oil produced. Oversupply leads to lower prices, so the market reflected it immediately.
What followed was a deflationary spiral across the world. Many types of inflation exist – disinflation (when inflation declines but remains positive), hyperinflation (when inflation rises extremely fast), or deflation (when inflation becomes negative).
Out of the three types of inflation, deflation is the most difficult to counter by central banks. This is why, when the price of oil dropped below zero, central banks were forced to accommodate the monetary policy even further.
Fast forward a year to the current times, and the price of oil trades above $60/barrel. Naturally, the move higher sparked fears of higher inflation, and, indeed, inflation shows its teeth around the world, even in the advanced economies. Now, central banks fear lagging the move higher in prices, so investors should be prepared for the next change in policy.
Therefore, changes in the prices of oil influence the monetary policy, and this, in turn, influences the value of financial assets.
Australia – China
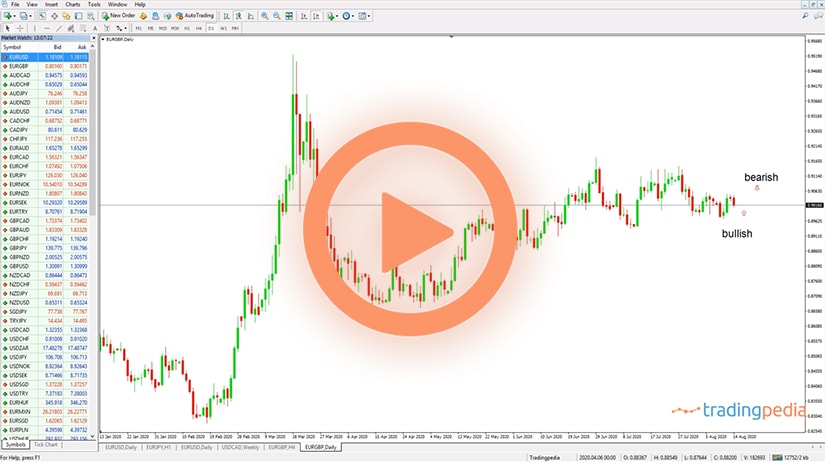
 Another interesting relationship to consider is the one between Australia and China. The two economies are linked in a direct correlation because a big part of Australian exports goes to China.
As such, there is a direct correlation between the Australian currency, the Australian dollar (AUD) and the news coming out from the Chinese economy. To exemplify, if the Chinese economy enters a recession, this is bearish for the AUD. Or, if the Chinese Gross Domestic Product (GDP) is revised higher, this is positive news for the Australian dollar.
Think of 2020 and the COVID-19 pandemic. The AUD currency pairs outperformed, mostly because China was one of the few countries in the world that registered economic growth in 2020. Because the Chinese economy recovered the fastest, imports from Australia started to pour in, supporting the Australian dollar and triggering higher commodity prices.
Because of the higher commodity prices, the Reserve Bank of Australia was tolerant with the higher AUD rates, as the increase in commodity prices tends to offset the currency’s strength.
One final thing to mention on this relationship – Sunday news. The FX markets are closed on Sunday, but often the economic calendar shows important data from China. This data, released on Sundays, often creates a gap on the AUD pairs when the FX market opens on Monday.
The correlation, a direct one, triggers a higher AUD on positive economic data from China, and a lower AUD on negative economic data. Therefore, one may say that what happens in China first affects the Australian dollar and then the rest of the world.