
Hello there, this is tradingpedia.com and this video refers to a very important topic in technical analysis – Japanese candlesticks patterns, known mostly as reversal patterns, and in this video, we will cover the hammer formation.
What is a Hammer Candlestick Pattern?
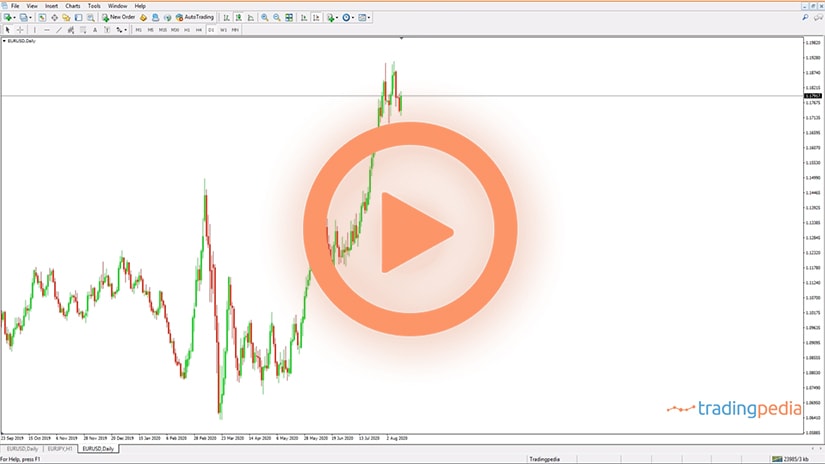
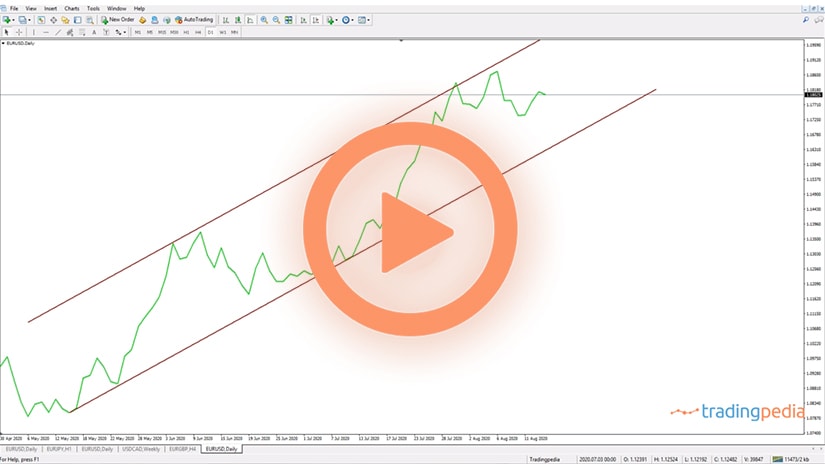
 This is the EURUSD daily timeframe and the hammer is a reversal pattern forming at the bottom of bearish trends. This is a single candlestick pattern, meaning that only one candlestick defines the pattern. It has a small real body (the distance between the opening price and the closing price). Whatever the market forms above the real body is called the upper shadow and below, the lower shadow.
For the hammer formation we need only one candlestick and it is characterized by a tiny real body (not a line like it is here, this is called a Doji candlestick), but something like this. To make the distinction from a Doji candlestick or another candlestick that looks like a hammer, but it is not a hammer, use the following trick – measure the length of the real body and project it minimum two times over the lower shadow’s length. If it fits, that is your hammer. If it does not fit, the pattern is not a hammer. For instance, this one here, if it would form at the bottom of a bearish trend, would not be a hammer because the real body does not fit twice into the lower shadow.
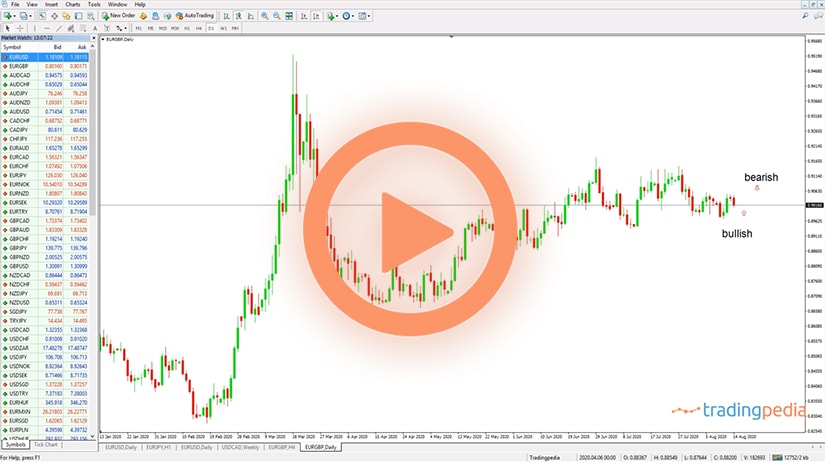
The opposite of a hammer is called a shooting star and appears at the end of bullish trends. On the hammer pattern, the market shows a battle between bulls and bears. Bears are in control, otherwise the market will not fall. But with the hammer formation, a bit of optimism appears on the market as bulls prepare to take control.
Trading the Hammer Candlestick
 To trade the hammer formation, you need to mark the lows and highs of the pattern and then you use the Fibonacci retracement tool to find out the 50% and 61.8% retracement levels. This would be the entry place for a long trade. So, to trade the hammer, you should wait for the market to come to 61.8% or 50%, depending on how aggressive you want to be in a trade.
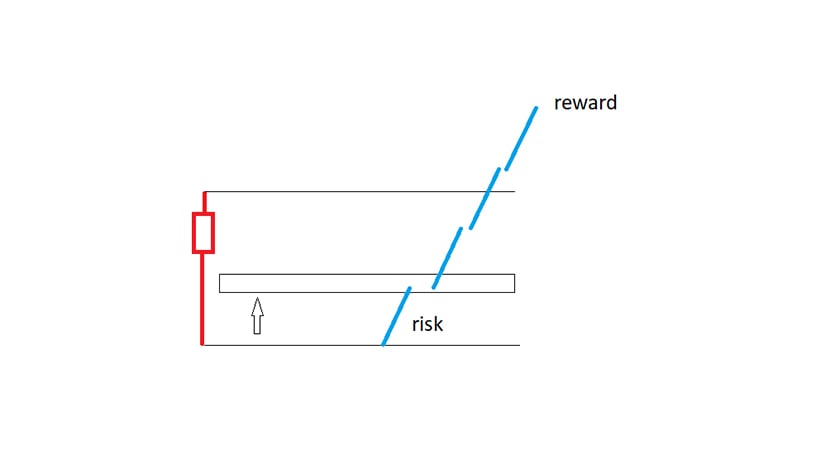
That would be the risk of a trade, and the stop loss order must be set at the lows here. Remember, the hammer formation as a reversal pattern shows a battle between bears and bulls and bears will not let it go that easy, they will try to push the market to a new low. Bulls, on the other hand, will try to position for the new bullish trend.
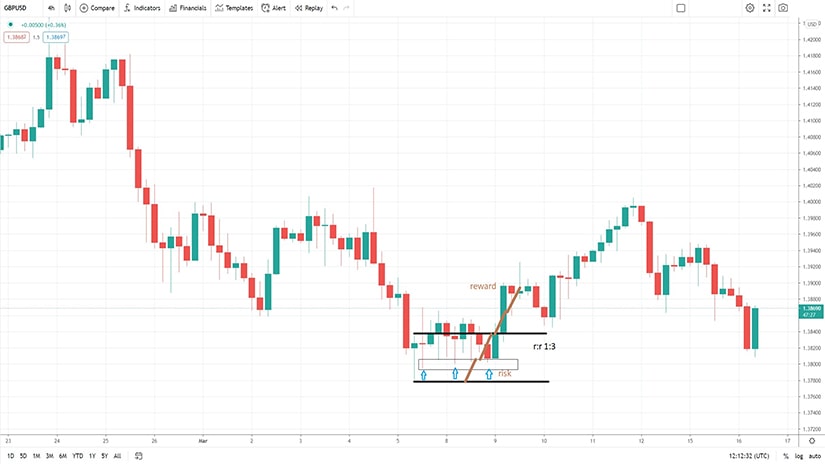
In order to apply a sound money management technique, one needs to use a risk-reward ratio of at least 1:2. Meaning, if this is the risk, 1% on one trade, the reward should exceed twice the risk. The higher the rr ratio, the better for the trader. In this case, then if we project the risk to the upside three times this would be the exit from the trade. So the entry is 1.0787 and exit at 1:3 risk-reward ratio.
In money management the volume traded is very important. Risking 1% of the trading account for a 3% reward is a good risk-reward ratio, better than the one offered by other classic patterns like the head and shoulders pattern for instance.
Related Videos
So this is how you trade the hammer formation. Another hammer would be this one here. If we measure the length of the real body and project it to the downside, we see the hammer. Then we measure the highs and lows, and use the 50% as an entry, this would be the risk and the reward is the risk projected to the upside three times.
Aggressive traders also trail the stop every time the market puts a new level in the risk reward ratio. For instance, if the market reaches the 1:2 rr ratio, then the trader trails the stop to the next level. Then the market goes for 1:3, the trader trails the stop again as the market is advancing. But 1:3 is enough for the account to constantly grow.
More Examples on How to Trade the Hammer Pattern
 Before looking at more examples involving the hammer pattern, let’s use a simple approach to trading the pattern. The hammer is just a single candlestick that forms at the bottom of a bearish trend.
Ideally, the market should retrace a minimum of 38.2% into the range defined by the hammer. Most of the time, the retracement exceeds 50% and even 61.8%, but sometimes there is no retracement.
The recommendation is to avoid trading hammer patterns that are not followed by a retracement into a minimum of 38.2% of the hammer’s territory. It does not mean that the pattern will not work; it only means that the price action does not align with what the hammer stands for.
Effectively, the hammer shows an ongoing battle between bears and bulls. In fact, bears are in control – this is why the presence of a bearish trend is a must for the hammer pattern. Because bulls want to reverse the trend, a hammer forms as a result of the clash between the two forces.
Naturally, bears won’t give way so easily, so a retracement is only normal. Some traders simply refuse to consider a valid hammer pattern if there is no pullback in the price action that follows.
Step-By-Step Trading Plan
 The image above reflects the steps needed to trade the hammer pattern. Before anything, make sure that there is a bearish trend in place before the hammer’s formation.
Next, wait for the candlestick to close. This is a crucial step, as many traders enter the market in anticipation, only to find out that the price action formed some other pattern instead of a hammer.
Moving forward, pending orders are mandatory. Simply place a pending buy limit order at 38.2%-50%-61.8% and wait. The bigger the retracement, the better the risk-reward ratio.
Finally, place a stop loss at the lowest point of the hammer and target a risk-reward ratio of 1:3 or even more.
GBPUSD – A Quick 1:3 Risk-Reward Ratio
 The first example comes from the recent price action and the GBPUSD 4h chart. The market rose above 1.40 after a massive rally that started in April 2020 and continued throughout the rest of the year and the beginning of 2021. After a double top at around 1.42, a bearish trend started as the pair declined all the way back to the 1.38 area.
For whatever reason, the market bounced, and a hammer patterned formed. The pending buy limit order was filled immediately after, on the first new candlestick, but that is not something that happens often.
Nevertheless, the market bounced and reached the target suggested by a risk-reward ratio of 1:3. As it can be seen, the market exceeded the target easily, extending the gains far more than 1:3. This is the reason why the hammer pattern is valued by technical traders as other patterns do not offer such impressive risk-return ratios.
Shooting Stars – The Inverse Hammer Patterns
 A hammer is a bullish pattern – it forms at the end of a bearish trend. A similar pattern, called a shooting star, is an inverse hammer and forms at the end of bullish trends.
Effectively, shooting stars mark a top just as the hammer pattern marks a bottom. Because it is an opposite pattern, all the trading rules remain in place, but traders go short, not long, when trade a shooting star.
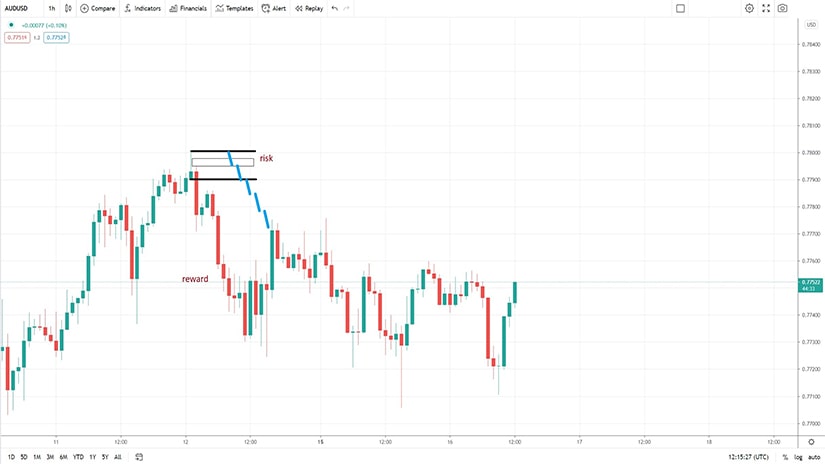
Here is a recent example on the AUDUSD pair. This is the hourly chart and the market formed a shooting star – a candlestick having a small real body and a long upper shadow.
After the shooting star formed, the market retraced about 38.2% of the distance from the highest to the lowest point of the star. That is just enough to fill the pending sell limit order in place after the shooting star’s formation.
The risk-reward ratio of 1:3 was easily reached, as the market declined faster. Depending on the trader’s aggressivity, one can easily get a risk-reward ratio exceeding the 1:3 level, by focusing on trailing stops and monitoring the price action on the lower timeframes.
Before moving to the next example, it is worth mentioning the importance of the timeframe analyzed. The rule of thumb says that the lower the timeframe, the weaker the support or resistance level given by a technical pattern or indicator.
In the case of the hammer pattern, the lower the timeframe, the bigger the chances that stop-loss order will be triggered. Naturally, the bigger the timeframe, the more difficult would be for the price action to reach the stop-loss order.
Confluence Areas With Multiple Hammer Formations
 A confluence area is defined as an area where multiple elements point to the same market direction. To exemplify, imagine the market reaching support on the SMA (200) or the Simple Moving Average that uses the last two-hundred periods to plot a value. If in that area another pattern shows reversal conditions, that is a confluence area – the more elements in such an area, the stronger the signal.
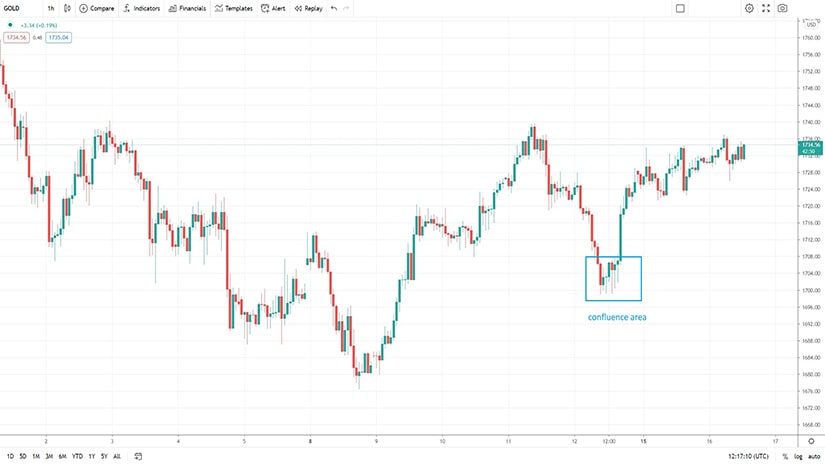
The gold chart below shows just such an area. This is the hourly chart, and the bounce from below $1680 was followed by a correction.
By the time the market formed one hammer pattern, two more followed. In total, we can spot three consecutive hammers, the last two reinforcing the signal given by the first one.
The confluence area shown above reflects perfectly the battle between bulls and bears. For a hammer to work, bulls must win, but bears do not give up without a fight. We see the $1,700 level holding nicely on every attempt of the market to close below – bulls prevailed as the confluence area was difficult to break.
Hammers are unique patterns in the sense that one single candlestick is responsible for fabulous risk-reward ratios. By applying the simple steps described in this article, traders stand to gain from one of the most robust money management systems that can be applied when trading financial markets.