
Hello there, this is tradingpedia.com and this video deals with the Relative Strength Index (RSI), one of the most important, if not the most important oscillators, a technical analysis tool used in retail trading. All investors have looked at one point in time at the RSI because its power is undeniable and works well both in trading and ranging markets.
What Is the Relative Strength Index
 The RSI is an oscillator and if you use the MetaTrader platform like this one here, you can insert it on any timeframe. You can find it under the Insert, Indicators, then we go to Oscillators, and this is the RSI. By default, it comes with a period of 14, meaning that the current value that the RSI shows refers to the last 14 candlesticks. This being the 4h chart, it means that the 14 periods refer to the last 14 four-hour periods. If you apply it on the daily chart, it will consider the last 14 days, and so on.
The RSI has two levels – 30 and 70. 70 is considered overbought, and 30 oversold. If you apply it on any chart, it will appear on a small window below the main price. The main idea with the RSI is to buy oversold levels, meaning every time it goes below the 30 is oversold, and we should buy. For instance, here you go on the long side, almost picking the bottom, and the same even here. Why? Because the RSI keeps coming to the oversold territory.
The opposite happens when the market reaches overbought territory – above the 70 level. Here we should go short when the market prints above 70. However, there is a catch, as trading is not that simple nor easy.
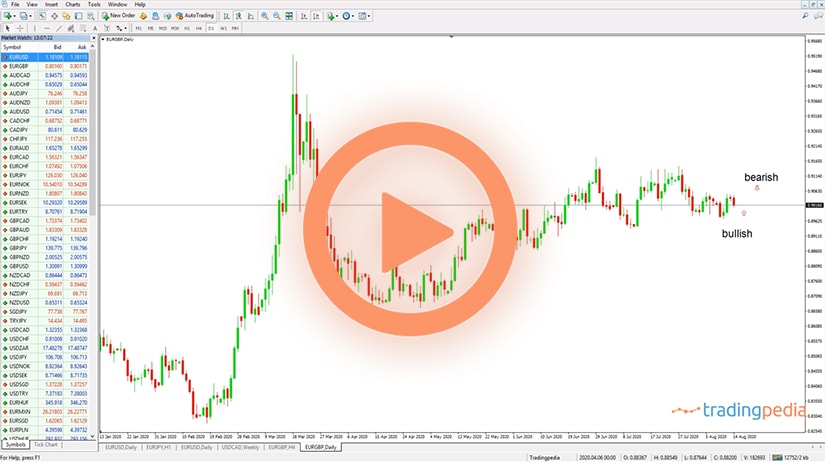
This strategy works very well if the market is in consolidation. As you can see, the EURGBP pair does not go anywhere since May 2020 and we see a horizontal consolidation around 0.90.
How about in a trending market? If that is the case, the RSI may remain overbought or oversold for quite some time. Therefore, this strategy works very well when you expect ranging markets. For instance, summer trading. It is known that during July and August prices consolidate more. Holidays, like Christmas, are also characterized by little or no trading activity.
Cross pairs, the ones that do not have the USD in their componence, consolidate more than major pairs. Also, think of lower timeframes, and trading crosses during illiquid sessions like the Asian sessions, known as slower price action like the Northern American session. So this is one way to trade with the RSI.
Look For Divergences
 Another way to trade with the RSI is to look for divergences, and this one applies to any other oscillator that has overbought and oversold levels. A divergence refers to the market making two consecutive lower lows and the oscillator fails to confirm the second lower low. Or the market forms two consecutive higher highs and the oscillator fails to confirm the second higher high. So, why should we trust the oscillator?
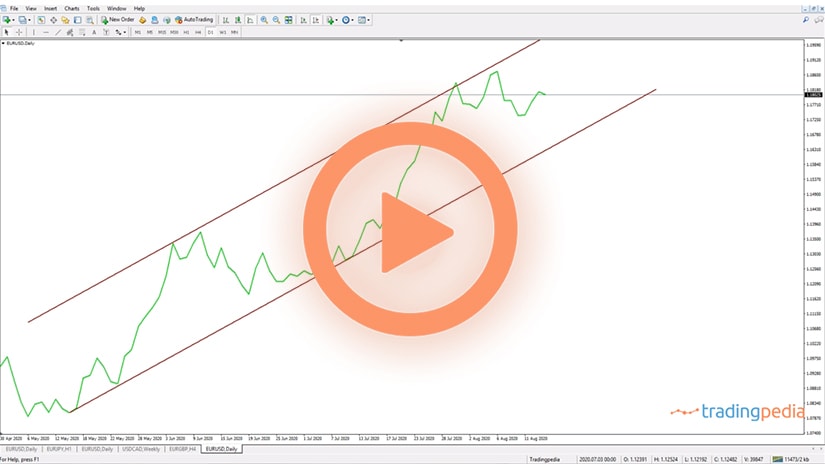
Remember, the RSI considers 14 candlesticks. So, this value here is based on the closing price of the previous 14 candlesticks. Therefore, if we are to consider that one of these two lines is giving false information, that would be the price, and not the oscillator. Therefore, in a bullish divergence you look for the market to form a series of two consecutive lower lows, while at the same time the RSI will not confirm the second one. This is why it is called a divergence, because here you have two lower lows and the two lower lows and the trendline has a falling angle, while this one has a rising angle because the second lower low is not confirmed by the RSI. Of course, after a divergence, the market bounces, and this is where the trade comes into place.
Related Videos
Bullish and Bearish Divergence
 As always, for any trade you must have a stop loss. The market may remain in a divergent mode more than the trade can remain solvent. If you want to wait for a market confirmation, this would be the bounce, and then going on the long side here with a stop-loss at the lows and targeting 1:2 risk-reward ratio would be appropriate for trading a divergence. This is called a bullish divergence.
But there is also a bearish divergence, based on the same principle. The market forms two higher highs, while the RSI fails to confirm those highs. Here, as you can see, it is a double bearish divergence.
Bearish divergence, bullish divergence – one calls for going short, the other one for going long. One more thing before we are done with the RSI – you can alter the RSI periods in any way you want.
For instance, the 14 period is the default number of periods considered when the RSI was first used and developed. But you can change it and set the RSI to use more or fewer periods. The more periods it will consider, the flatter the line will become, and the more difficult it would be for it to reach the overbought and oversold areas. So if you want to filter the signals when trading with the overbought and oversold trading strategy, you may want to increase the number of periods to make it more difficult for the RSI to reach overbought or oversold and then by the time it will reach it you will go a bit more aggressive, as you will have more confidence on that trade. The same remains valid for bullish and bearish divergences.
More Examples on How to Use the RSI When Trading Financial Markets
 As an oscillator, the RSI guides traders and warns when the market is about to reverse or even to continue in the same direction. Like most oscillators, the information provided is more precious than what the actual price does, for the simple reason that the oscillator considers more periods before plotting a value.
In the case of the RSI, the standard (default) setting considers fourteen periods and is usually based on the closing price. Traders may choose to change the number of periods, but one should keep in mind that a bigger number flattens the RSI line, while a smaller one makes it easier for the oscillator to reach overbought and oversold levels.
Overbought and Oversold Levels With the RSI
 As mentioned earlier, the RSI highlights two different levels – one for overbought market activity and one for oversold. When applied on a chart, the RSI(14) looks like below. This is the USDJPY 4h timeframe, showing the recent move higher on the pair since the last quarter of 2020.
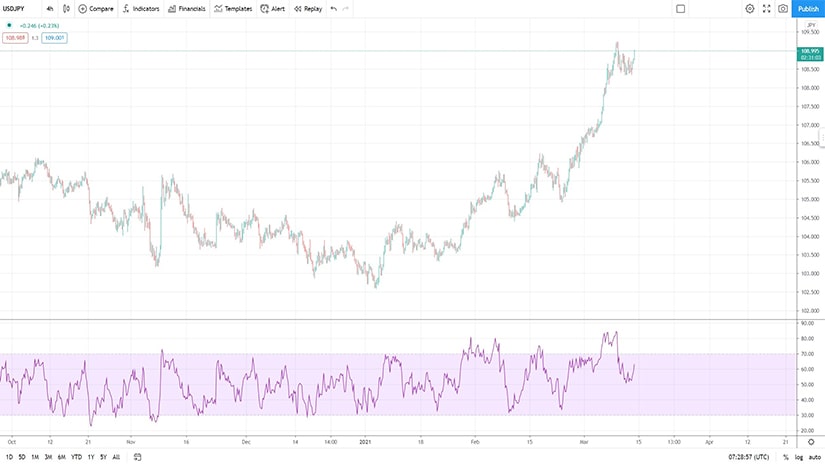
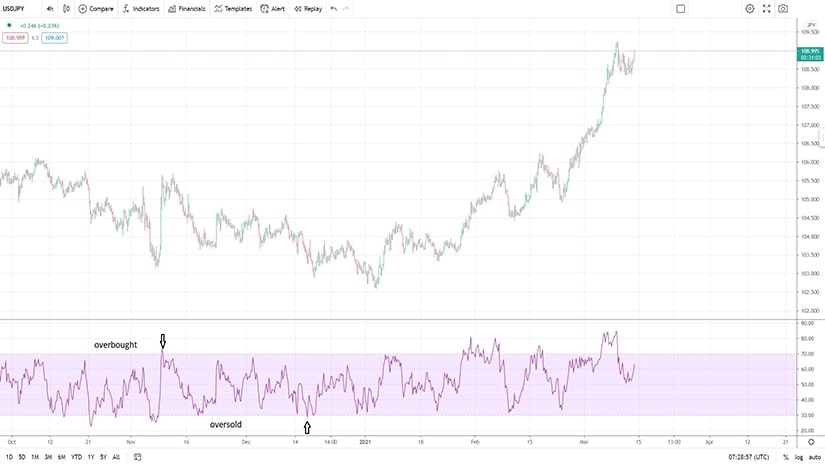
The RSI highlights the area between 70 (overbought) and 30 (oversold). That is the “normal” area or the area where the oscillator spends most of the time. It is when the RSI reaches 70 or 30 that things become more interesting.
RSI – Standard Interpretation
 The basic way of using the RSI is to wait for the oscillator to reach overbought (i.e., above 70) or oversold (i.e., below 30) before going short or long. However, trading is not that easy, and a couple of things are worth mentioning here.
One refers to the way the oscillator computes the data. If it is computing it considering the closing prices of each candlestick, then the trader must wait for the candlestick to close and only after that to interpret the RSI’s value. More precisely, during the 4h time that it takes one candlestick to form on the USDJPY chart below, the RSI may be overbought or oversold, and then the market to retrace right before the candlestick’s close. Therefore, a mandatory condition when trading with the RSI is to wait for the time of each candlestick to expire.
Another thing is that trading overbought and oversold levels work only when the market is in a range. Or, when it trends in “slow-motion”, forming multiple pullbacks. In strong trends, the RSI may remain overbought and oversold for a long time, leading to the inexperienced trader to take losses.
Contrarian Trading with the RSI – Interpreting Divergences
 One of the most powerful ways to use the RSI is to interpret divergences. Depending on where they form, at the bottom, respectively at the top of a trend, divergences are bullish, respectively bearish.
Divergences show the true importance of multiple periods considered by the oscillator. A close look at any of the charts part of this article reveals that most of the time, the RSI follows the market price action closely. However, from time to time, the move between the two (i.e., the market price action and the oscillator) diverge. It is such a moment that the trader must place trust in the oscillator, and not the price, for the single reason that the oscillator considers more data when plotting a value. Instead, the price action refers to one single candlestick – the current one.
A bullish divergence forms when the market price action forms two lower lows. Nothing signals a possible reversal, except that the RSI does not confirm the second lower low. More precisely, the RSI does not form another lower lows, while the market does. Hence, the two diverge, and a bullish divergence is a straightforward way to make the most of a market by going long or buying the asset.
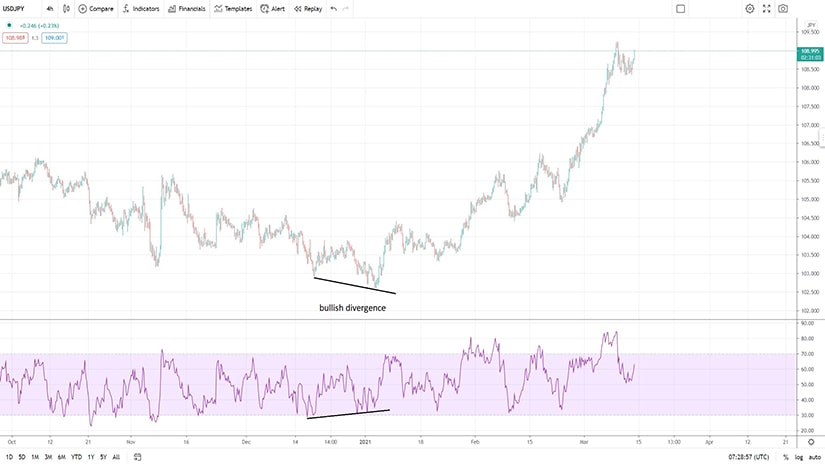
Here are the steps. First, the trader waits for the divergence to form. Second, by the time that the RSI rises above 40, traders go long with a stop at the lowest point the market made during the divergence. Finally, the take profit is set by calculating the distance to the stop and projecting it twice or three times from the entry-level. This way, traders obtain an appropriate risk-reward ratio.
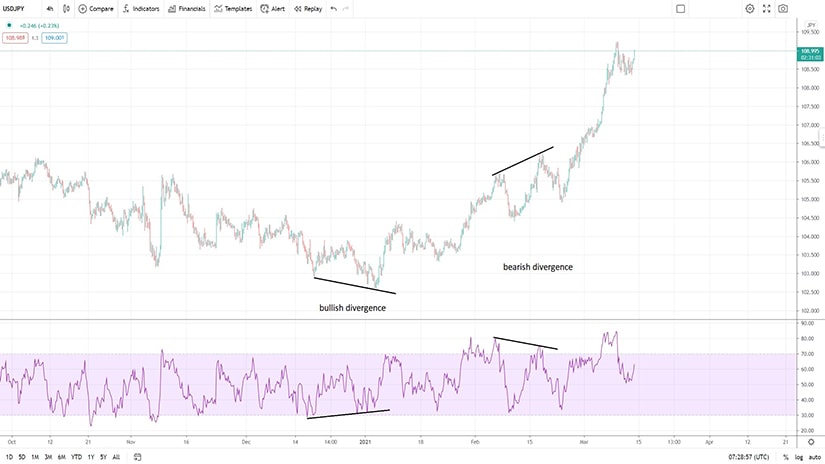
A bearish divergence is the opposite of a bullish one. Everything related above should be done when interpreting a bearish divergence, only using the opposite logic (i.e., selling, instead of buying).
The chart above shows that not all divergences work. If they did, trading would be too easy – which is not. This is why it is crucial to always have a stop-loss in place, as well as an appropriate risk-reward ratio.
The bearish divergence from above did not work. However, it did not work because the RSI actually formed a continuation pattern.
Continuation Patterns with the RSI
 Besides overbought and oversold areas and trading divergences, the RSI also forms continuation patterns. Although they appear less frequently, they are extremely powerful, as revealed by the chart below.
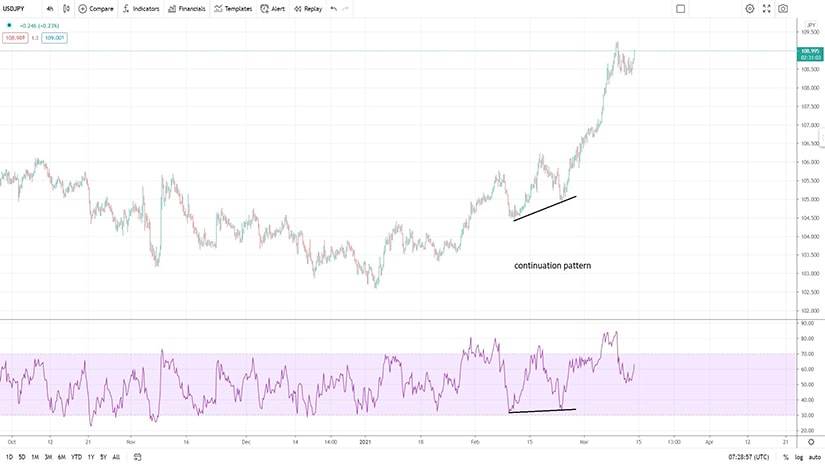
For a bullish continuation pattern, the following conditions must be in place. First, the market forms a higher high and the higher low – that’s bullish. Second, the RSI confirms the second higher low, meaning that it fails to drop below the previous higher low. Therefore, that is a bullish continuation pattern, and the secret is to wait for the market to make a new higher high before going on the long side.
On a new higher high, traders go long with a stop-loss order at the previous higher low and a take profit that equals twice or three times the risk taken.
In other words, the bearish divergence did not work for the simple reason that the market formed a continuation pattern. Hence, when the market triggered the stop on the short trade, it activated the long on the continuation pattern, so the savvy trader recovered the loss and made some more. Once again, this is another example of how basic money management and risk-reward ratio contribute to the steady rise of a trading account.