
Hello there, this is tradingpedia.com and this video deals with the Elliott Waves Theory. We continue with the Elliott Theory – we already introduced the notions of impulsive and corrective waves and of labeling impulsive waves with numbers and corrective waves with letters. At this point we move forward with simple corrective waves with the Elliott Waves Theory. Here we lay down the principles and we look at some examples on the market.
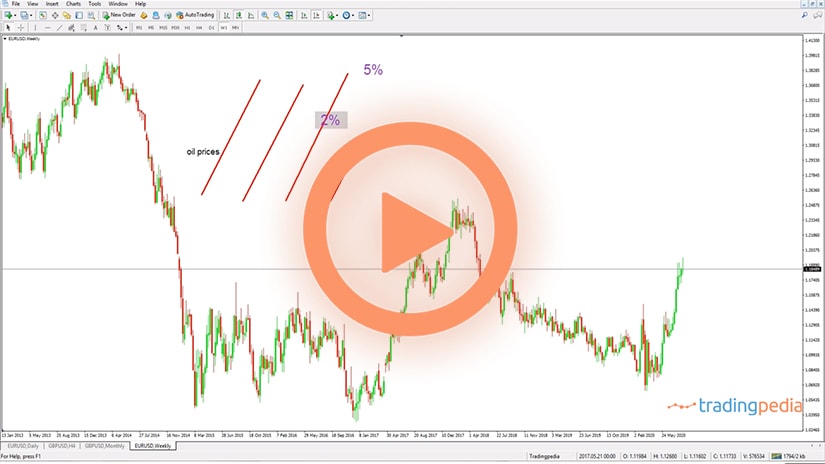
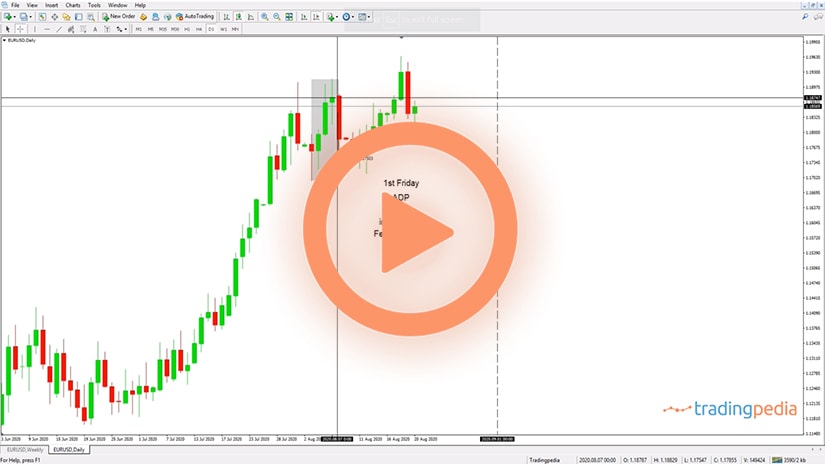
This is the EURUSD at 1.1908 on the first day of September, rejected at the 1.20 level. I will use this part of the chart for the theoretical part.
Elliott Waves Theory – Principles and Examples
 Elliott identified only three simple corrective waves. These are – flat patterns, zigzag patterns, and triangles or triangular patterns. These is everything you need to know about corrective waves with the Elliott Waves Theory.
From these three patterns the theory evolves into more patterns, but if you understand these patterns when it comes to corrective waves, then you are on the right side of the market. Being corrective waves, they are labeled with letters, and not numbers.
These are three’s, or a-b-c. A flat and a zigzag are labeled a-b-c and a triangle is labeled a-b-c-d-e, although it has five segments. So, how come a triangle is called a “three”, when it has five segments? The answer is that all the segments are corrective.
Flat Pattern
 The difference between the three patterns comes from the internal structure of each wave. For instance, for a flat pattern, let’s assume we have a bullish trend and then the market forms an a-b-c. A flat. The key is that the b-wave retraces more than 61.8% into the territory of the previous wave a. Moreover, waves a and b are corrective, while only wave c is impulsive. This is a flat and there are various types of flats and we will cover them here later in this academy.
Zigzag Pattern
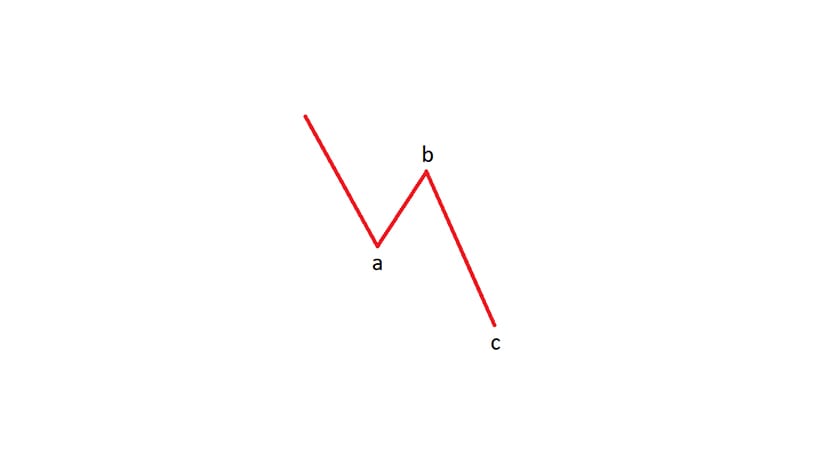
 A zigzag pattern, if we assume a bullish trend, the market forms an a-b-c. The difference is that wave a is impulsive, wave b is corrective, and it is not strong enough – it fails to retrace more than 61.8% of wave a. So, if you are expecting a corrective pattern and the b-wave fails to retrace more than 61.8% of wave a, you know you will expect either a flat or a triangle. And then if you see that the c-wave is impulsive, this is not a flat, and most likely will be a triangle.
In a zigzag both waves a and c are impulsive and only wave b is corrective. In a flat, wave a is corrective, wave b is corrective, and only wave c is impulsive. This is called a zigzag. They are not so common like flats – there are ten types of flats but only three types of zigzags.
Triangle Pattern
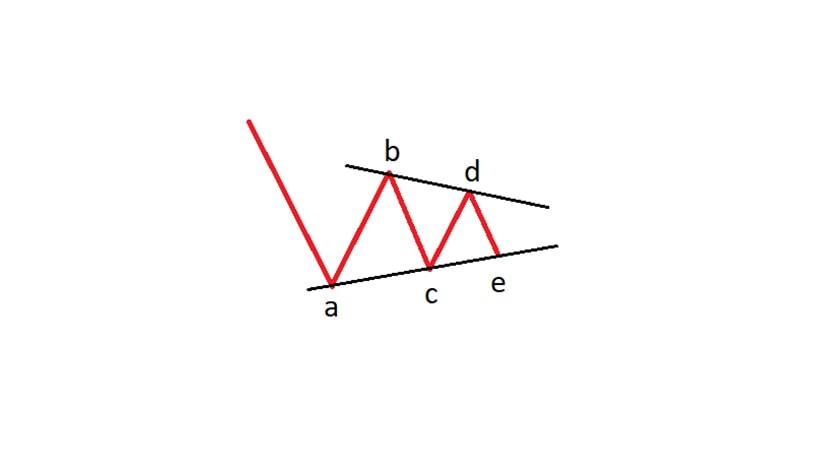
 The last simple correction is called a triangle. Imagine that the market forms five segments after a bullish trend – a-b-c-d-e. All segments are corrective – wave a, for instance, may be a zigzag, a flat, or a complex correction. All of them are corrective, and none is impulsive. You may still have impulsive activity, but it is either a terminal impulsive move or only part of a leg of a triangle.
Why is it called a triangle? If you connect the b-d and the a-c trendlines, they will contract or expand, looking like a triangular pattern. Triangles form everywhere, they are more common than flats.
Related Videos
These are all the simple corrections the Elliott Waves Theory covers. You might say that there are other patterns you may be familiar with from the Elliott Waves Theory. You are correct, but they all derive from simple corrective waves.
When we will introduce the notion of the x-wave, you will understand how that goes. Before that, look at the EURUSD how it formed higher lows and lower highs, basically the price action contracted. If it contracted, we could imagine a triangle a-b-c-d-e, a triangle as a reversal pattern. We will not discuss here the rules of a triangle, what is needed for the b-d trendline or the a-c one – we will do this on a different occasion.
Simple Corrections – The Rules To Remember
 Ralph Elliott built the Elliott Waves Theory to explain the stock market moves. He noticed that the market’s behavior is repetitive, and, as such, he documented the patterns.
The theory in itself is pretty old. It was published and revised before the 1950s, so it was not meant to address other financial markets. At that time, besides the stock market, only the commodity traders had historical price data to apply technical analysis principles.
Moreover, technical analysis was at its incipient phases, but exactly for the same reason – lack of data. As time passed and the financial markets evolved, new products appeared. After the 1970s, when the United States dropped the gold standard, the fiat currencies started to free-float against each other.
Suddenly, the global currency market presented opportunities unseen before. Yet, the Elliott Waves Theory, built to explain the market participants’ behavior, works on the currency market too.
In fact, it works on all markets, providing there is enough data to analyze. Think of the cryptocurrency market, for instance, which is pretty young compared to the traditional currency market. Yet, many traders use the Elliott Waves Theory to count the intraday waves, so as to form an educated guess about where the market goes next.
The entire theory is based on two concepts – impulsive and corrective waves. The corrective waves further subdivide into two distinct categories – simple and complex corrections. Out of the two, the simple corrections are key to understanding how Elliott viewed the corrective activity.
Complex corrective waves are based on the simple ones. More precisely, they are combinations of simple corrective waves, connected by one or two intervening waves.
Elliott identified only three types of simple corrective waves – flats, zigzags, and triangles.
What Makes a Flat
A flat is a three-wave structure that corrects in the opposite direction of the underlying trend. That is, if the market trend is bullish, the flat pattern is bearish. Or, if the market trend is bearish, the flat pattern is bullish.
Rules to remember when interpreting flat patterns:
- Wave a is corrective, and it can be either a simple or a complex correction
- The b-wave must retrace more than 61.8% in the wave a’s territory
- Wave b is also a corrective wave, and can either be simple or complex
- If wave b is a simple correction, it can only be a zigzag or a flat of a lower degree, and not a triangle
- Wave c is an impulsive wave, a five-wave structure
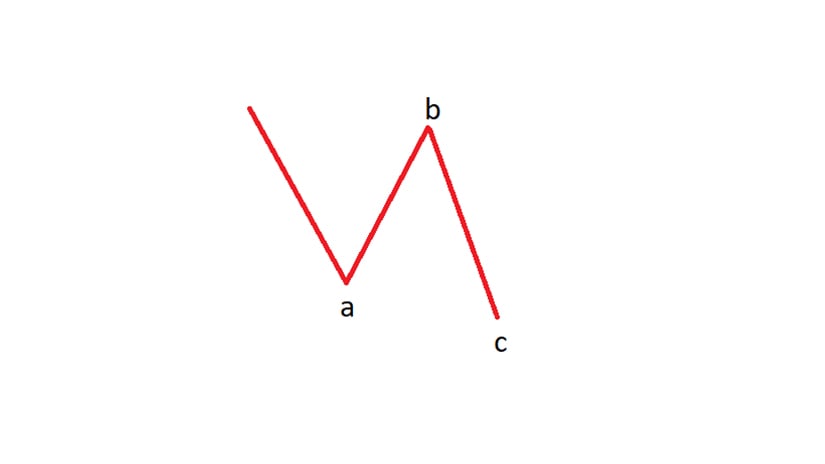
These are the mandatory rules to consider when interpreting a flat. Based on these rules, a flat pattern looks like below.
Note the strong b-wave’s retracement into the wave a’s territory, as well as the c-wave’s length that exceeds the start of the b-wave. However, both the b-wave and the c-wave’s lengths may differ, giving birth to other types of flats.
Ralph Elliott found no less than ten different types of flats, based mostly on the length of waves b and c. We will not list here all of the types, but the reader should be aware of flat types such as a flat with a b-failure, with a double failure, an elongated flat, or a flat with a c-failure.
What Makes a ZigZag
A zigzag is similar to a flat pattern, with the main difference being the b-wave’s retracement. If during a flat’s formation, the b-wave must retrace beyond 61.8% of wave a, such a move is forbidden in the case of a zigzag formation.
In fact, most zigzags have the b-wave quite short, often failing to retrace even beyond the 38.2% distance of wave a. Here are some mandatory rules to consider when interpreting a zigzag:
- A zigzag is a three-wave structure, labeled a-b-c
- Both waves a and c are impulsive
- Only the c-wave may be a terminal impulsive wave
- The b-wave must be less than 61.8% of wave a
- The b-wave must retrace minimum 1% into the wave a’s territory
Just like in the case of flats, Elliott identified different types of zigzags, all based on the c-wave’s length. If the c-wave is shorter than 61.8% of wave a, the market formed a truncated zigzag. If it is longer than 61.8% of wave a, but not longer than 161.8% of it, the market formed a normal zigzag. Finally, if it is longer than 161.8% of wave a, the market formed an elongated zigzag.
What Makes a Triangle
A triangle is the most common pattern part of the Elliott Waves Theory. Triangle come in many types and shapes, but they all respect the following rules, as listed by Ralph Elliott:
- A triangle is a five-wave structure labeled with letters: a-b-c-d-e
- All segments of the triangle are corrective in nature
- The b-d and a-c trendlines define the triangle
- The b-d trendline is the most important one and very often retested by the price action once broken
Classic technical analysis defines triangles as ascending, descending, or symmetrical. Elliott went a step further and assigned labeling, plus divided the different types of triangles into various categories based on when they form.
As such, Elliott traders distinguish between limiting and non-limiting triangles, irregular or running triangles, or special triangles that have a different a-c trendline than other types.
Examples of Simple Corrections on the GBPUSD Weekly Timeframe
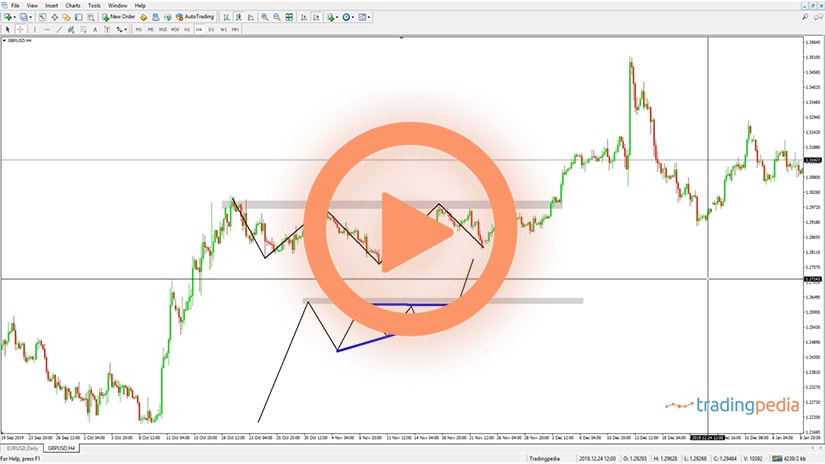
 Below is the GBPUSD weekly timeframe, showing the price action in the past four years. In the aftermath of the 2016 Brexit vote, the pair crashed to the 1.15 area all the way from 1.50.
On its move lower, right at the bottom, the market formed a triangular pattern. In this case, the triangle acted as a reversal pattern, suggesting it was part of a complex correction. However, complex corrections are formed by simple corrections connected by intervening x-waves.
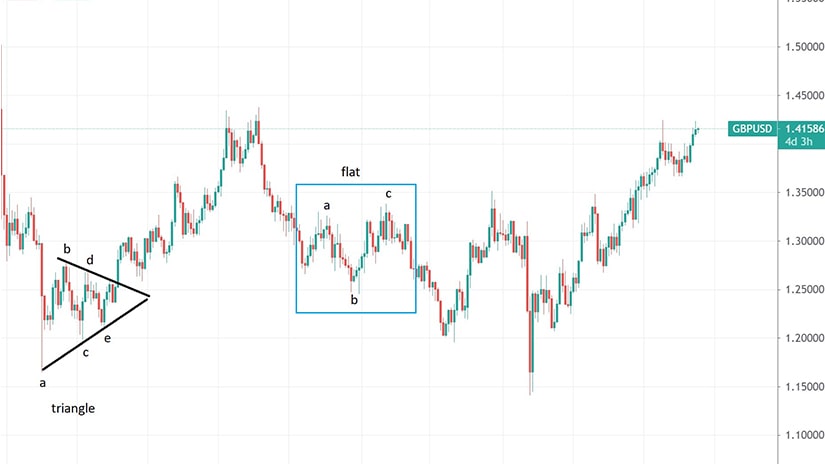
Fast forward a couple of years, and during a bearish trend, the market formed an a-b-c, or a flat pattern. Remember that flat patterns correct in the opposite direction of the underlying trend. In this case, the flat was bullish, while the trend was bearish.
We note the b-wave’s retracement exceeds the minimum of 61.8% of wave a, and it retraces much more than that. Finally, by the time the impulsive structure in the c-wave ends, the flat pattern ends as well and the bearish trend resumes.