
Hello there, this is tradingpedia.com and this video deals with a technical analysis concept called ascending and descending triangles. These continuation patterns and triangles are everywhere. They are one of the most common patterns that exist on technical analysis and they form on any type of market.
Overview
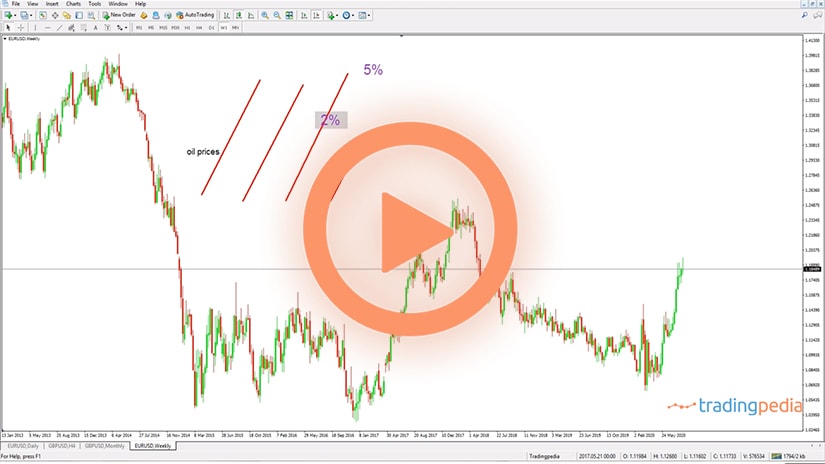
 On the FX market is a bit difficult to interpret an Interpreting Ascending and Descending Triangle because the volatility is a bit higher when compared to other markets. It is one thing to look at a continuation pattern like this on the stock market and another thing to do the same on the FX market. But with a bit of a flexibility in mind and respecting the rules of a triangle, anything can be done.
This is how a triangle looks like. During an ascending triangle’s formation you will see bullish price action and then the market meets resistance at an area. It is not a specific level, but an area, give it or take some twenty or thirty pips, something like this. This is the GBPUSD 4h chart, known as one of the most volatile currency pairs on the FX dashboard.
And then the price meets resistance against a horizontal base. At first, it is being rejected. However, bulls step in again, try again for the area, maybe delivering a marginal high or not, but this is an area that rejects the price. Next, the market moves to the downside, but fails to take these lows, and then tries again, fails again, and eventually breaks higher. This coiling price action against a horizontal base is what makes an ascending or descending triangle.
In order to a textbook material if you want you may connect these levels using a trendline in order to note the price action. And then, if you copy this one and you project it on the lows, the ascending triangle becomes obvious. So the price action coils, builds energy to break higher, and eventually breaks highs.
An ascending triangle differs from a regular triangle in the sense that the price action gets closer to a horizontal resistance. That is the main difference. It also has a measured move – 75% of the longest wave of the triangle. It doesn’t necessarily mean that the longest segment is the first one, but usually it is. This one, projected on top of the horizontal area, gives the minimum distance that the market should travel.
The Minimum Distance
 The minimum distance means that we should not expect a reversal after that, it only confirms the pattern. The same rules discussed for the ascending triangle are valid for a descending triangle, only that this time the price finds a bottom, or a temporary bottom, and bounces from it, but the bounce is not strong enough to break the series of lower highs and eventually the support will break.
Often, the price will retest the upper or lower edge of an ascending, respectively a descending triangle. In this case, GBPUSD rallied from the lows in an almost vertical move, and at one point in time it hesitated. It was rejected, came back, and even coiled all the way until breaking here. So this is an ascending triangle – the first segment, the second one, this one here, like this, and then another move here, and eventually it popped higher.
When it did so, the measured move is the longest segment projected from the breakout point and that is the minimum distance that the market should travel. This is called trading with a pattern recognition approach and this triangle it may not look like an ascending triangle, but how about this one? You can interpret this one being the first segment, this the segment, this the third, the fourth, the fifth, and then it broke higher. What is important to remember here is that these five segments, against a horizontal resistance, always lead to an ascending triangle, if the price will not break the series of higher lows. Obviously, the opposite is valid when you trade a descending triangle.
Related Videos
What is important when dealing with ascending and descending triangles is to remember that these are classic technical analysis patterns. They come from the stock market in the United States but can be used on any market.
At one point in time, during a trending market, the price stalls at a level and it forms a continuation pattern. It has some troubles continuing, either to the upside or to the downside. The series of higher lows or lower highs reveal the strength of the trend. By the time the price breaks the horizontal base of the triangle, you simply check the longest segment of the triangle, project it from the horizontal base, and that is the minimum distance that the market should travel.
Examples of Ascending and Descending Triangles
 Triangles are of multiple types. They can act as continuation or reversal patterns, can be contracting or expanding, horizontal or running, symmetrical or irregular, limited or unlimited, ascending or descending.
But regardless of the type of triangle, they all have similar characteristics. Namely:
- A triangle is just a consolidation area
- According to the Elliott Waves Theory, it must have five segments
- The segments may have multiple subsegments
- Triangles act either as continuation or reversal patterns
- All triangles have a measured move
Perhaps the large variety of triangles is confusing to the trader, but the name is suggestive of what is the next market move. Therefore, in the case of ascending and descending triangles, they are continuation patterns.
As the name suggests, an ascending triangle is a bullish continuation pattern, while a descending triangle is a bearish continuation pattern. They both put pressure against a horizontal area that provides either support or resistance.
This should be the focus of every technical trader when dealing with ascending and descending triangles – the horizontal area that acts as resistance, respectively as support. Without it, we cannot talk about an ascending or descending triangle.
Although the rules are clear regarding the horizontal resistance or support, traders must adapt to the FX market’s reality. Effectively, because of the high volatility levels, traders must be flexible when interpreting an ascending or descending triangle. More precisely, do not look for exact horizontal levels, but for an area that defines the resistance or support.
The derived measured move is equal to the longest leg of the triangle, projected from the horizontal area. However, traders should keep in mind that this is the minimum distance the market should travel. As such, most traders book half of the profits when the market reaches the measured move, change the stop to break-even, and then keep the other half for more.
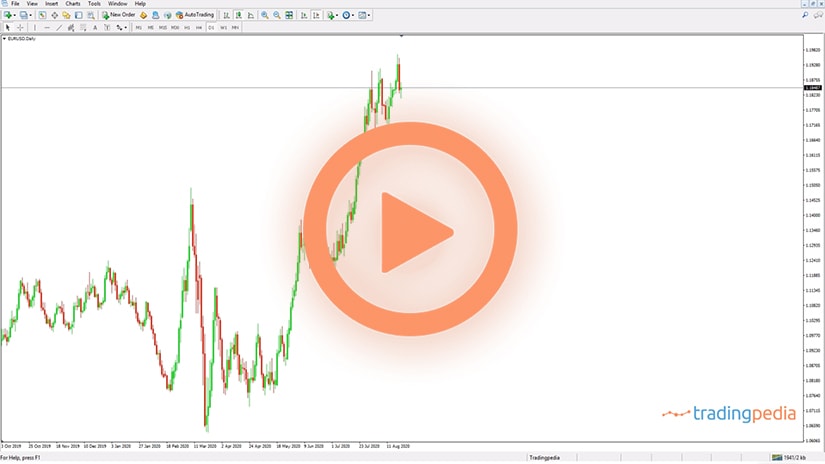
EURUSD – Ascending Triangle as a Continuation Pattern
 Our first example comes from the EURUSD pair. The pair dropped from above 1.23 to 1.17 during the first three months of the year.
The drop was mainly caused by profit-taking after the 2020 pandemic-led rally and by the European Central Bank (ECB) promising more asset-buying in March. As it turned out, the ECB did not deliver on its promises, and so the EURUSD pair reversed right from the first trading day of April. From that moment on, it did not look back until the 1.2150 area.
The bullish trend was built on a series of higher highs and higher lows. This series is very important when interpreting ascending or descending triangles. For example, in the case of an ascending triangle, all the pullbacks from the horizontal area should not break the series of higher lows. If one of the pullbacks does so, it is usually the last leg of the triangular pattern.
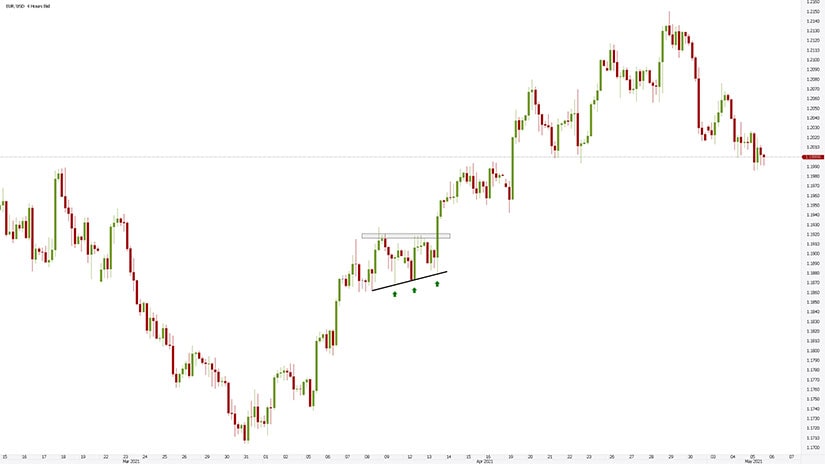
On its way up, the EURUSD met horizontal resistance and consolidated below. In doing so, the series of higher lows remained intact, suggesting an ascending triangle is forming. Because of the larger timeframe and the horizontal resistance, the triangle was easy to spot by technical traders.
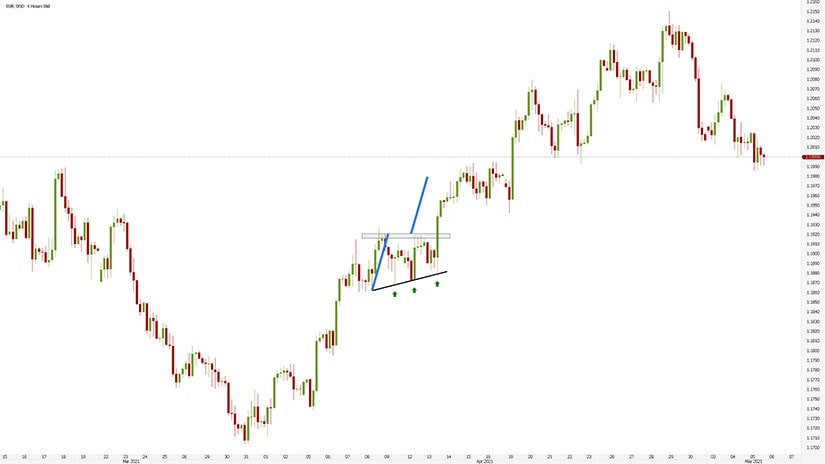
Interpreting the Measured Move
 The measured move is signaled with the color blue. The price usually reaches the measured move in less than the time it took the triangle to consolidate. If more time passes and the market did not reach the minimum distance, traders close the position and look for other patterns. Basically, the triangle was not confirmed.
But in this case, it was confirmed. The EURUSD reached the measured move quite fast. If traders followed the strategy explained earlier, to book half of the profits, raise the stop to break even, and stay long for the rest, they made more from the move because the bullish trend continued.
How about the stop-loss order? In an ascending or descending triangle, the stop must be set at the previous market swing (i.e., higher low or lower high, depending on the triangle’s nature).
A Descending Triangle on the Dax Index
 The first thing that strikes the eye on the chart below is how the horizontal area is defined. As explained earlier, it is not about the absolute lows but about and area that the market has a hard time to break.
Also, each bounce that followed failed to break the previous lower high. Thus, the conditions of a descending triangle were met.
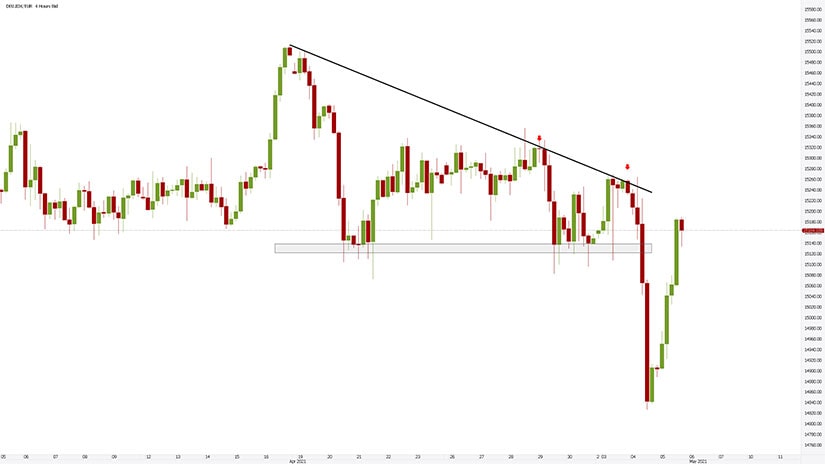
Remember that traders usually place a pending order, a sell-stop order, to trade a descending triangle. Because the stop-loss level is known in advance (i.e., the last lower high), and because the market’s volatility is unknown, many traders use risk-reward ratios as part of their money management system.
The typical risk-reward ratio is 1:2, meaning that for every $1 risked, the trader stands to gain $2. Or, for the distance to the stop, the trader sets the take-profit at twice that distance projected from the entry-level.
How About the Measured Move?
 In this case, the market did not reach the measured move. However, it did travel over 75% of it, considered sufficient to confirm the descending triangle by many traders. Moreover, it reached the 1:2 risk-reward ratio mentioned earlier.
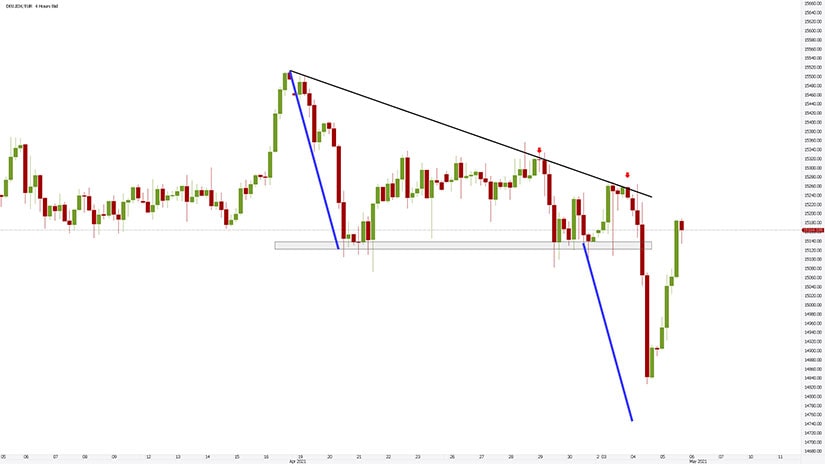
An important detail when trading ascending and descending triangles is that the price action should not retest the triangle’s trendline. This is unusual, because on many other types of triangles, the retest is mandatory (e.g., non-limiting triangles). Therefore, when the market retests the breakout point, it is, in fact, invalidating the ascending or descending triangle.
To sum up, look for these patterns to broadly respect the following steps. First, a horizontal area that provides resistance or support must exist and be obvious. Second, the market pullbacks should not break the series of higher lows, respectively lower highs. Third, the measured move is just the minimum distance the market should travel. Finally, the price action should reach the measured move in less than the time it took the triangle to form.