
Hello there this is tradingpedia.com and this video deals with one of the most interesting and curious Japanese candlesticks patterns – the Doji candlestick. It is a tricky pattern because it signals uncertainty, meaning that the market may move in the same direction but also meaning that it may reverse aggressively.
Doji Candlestick – Basic Principle
 The basic principle behind the Doji candlestick is that it looks something like this, like a cross. Depending where it forms, there are various types of Doji candlesticks, but more or less they all show the same thing – uncertainty. So whenever you see a candlestick like this, it signals uncertainty. The bigger the timeframe, the bigger the uncertainty.
Doji candlesticks on some timeframes are very tricky, and I will explain here why. First of all, a Doji candlestick has the same opening and closing prices, meaning that it has literally no real body.
But on the currency market this is tricky because the currency market has quotes with five digits, with the exception of the JPY rates that have three. It is very difficult to have the exact opening and closing price on a currency pair like the EURUSD as the fifth digit in the rate changes very fast. Therefore, one needs to be very flexible when interpreting Doji candlesticks especially on the lower timeframes.
Also it is literally impossible to have the same closing price on the weekly or monthly chart. In order to have a true Doji candlestick and assuming that the week opened at 1.18416. For the EURUSD to form a true Doji candlestick, it must close exactly at the same level – 1.18416. What are the chances for this to happen? Very slim. Not that it is impossible, but very slim.
Therefore, we need to be a bit more flexible and accept as Doji candlesticks even candlesticks that do have a small real body. Like this one here – this is Doji candlestick, even though there is a difference of six pips between the opening and closing prices.
The Timeframe
 Another thing to consider is the timeframe. This is the daily chart, but on brokers that show the Sunday candlestick, every five candlesticks you will have one small candlestick that resembles a Doji, but we should not consider it as a Doji candlestick because it shows only the trading activity for a few hours on Sunday. Therefore, it would not be correct to interpret it as a full daily candlestick.
Let’s try to find out on this chart a candlestick that resembles a Doji and try to trade it. Remember what it signals – uncertainty.
This would be one Doji candlestick that acted as a reversal pattern. This is also of a particular importance because the market fell, formed a bearish candlestick, one Doji candlestick and a bullish candlestick that retraces more than 50% into the territory of the previous one – this is called a morning star.
Let’s look back in time where do we have more Doji candlesticks. Here, for example. The real body is very small, forming on the lower part of the candlestick, as it has a very short lower shadow and a very long upper shadow.
This is called a Southern Doji, and it is a more powerful reversal pattern. When the cross forms here, and the Doji candlestick has a smaller upper shadow and a longer upper shadow, that is called a Northern Doji.
When a Doji candlestick has very long upper and lower shadows it is called the rickshaw man. It also shows uncertainty, in the sense that the market prepares for a breakout.
So, Doji candlesticks reflect uncertainty, consolidation, but also continuation. In this case this Doji consolidation reflects consolidation, the market bounced from these levels to 1.12 based on one simple candlestick.
If we are to generalize what a Doji candlestick stands for, that is a reversal pattern. Have a look here – this is a Doji, the market bounced, this is another, a rickshaw man that acted as a continuation pattern. Whenever you see such a candlestick on the bigger timeframes, watch for the price to break its extremes, put a stop loss at the lows, in this case, and go for a risk-reward ratio of 1:2.
It is also useful to wait for the price to break the edges of a Doji and to wait for the market to close the period before going long or short.
Related Videos
Doji candlesticks show uncertainty; they can act either as a continuation or reversal pattern; wait for the price to break the range of the Doji candlestick before going long or short; have a stop-loss at the opposite side; go for a risk-reward ratio of minimum 1:2; think of the Doji candlestick in combination with other patterns to provide more confidence in a trade.
What Makes a Doji Candlestick?
 A doji is a candlestick that has similar open and closing levels. Originally, the definition of a doji candlestick required identical levels for the opening and closing prices, but that changed in time as the brokerage houses offered improved technologies.
For example, prior to the introduction of the five-digit quotations, doji candlesticks appeared more often on charts. Put it simply, it was easier for one candlestick to have similar opening and closing levels when the quote had only four digits.
Therefore, when interpreting doji candlesticks, the trader must keep in mind that the levels must not be identical, but similar.
One doji candlestick shows hesitation. It can act as both a continuation and a reversal pattern and the more doji candlesticks form, the more important the area is.
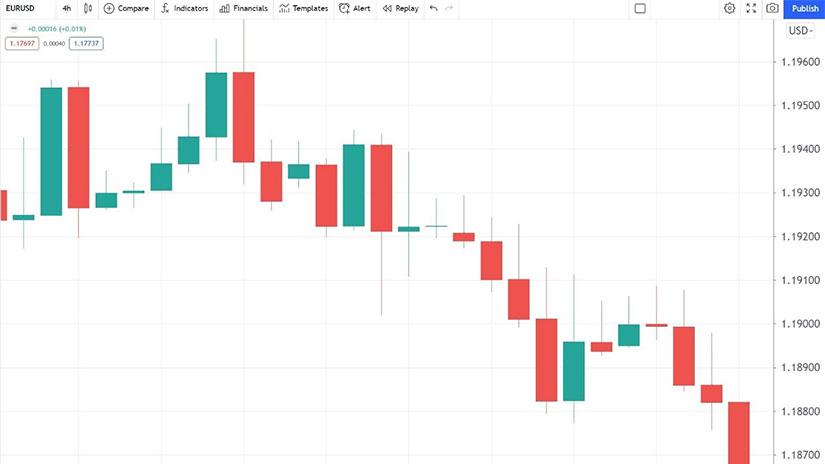
Let’s have a look at the chart below. This is the EURUSD 4h chart, showing various candlesticks in green (bullish) or red (bearish).
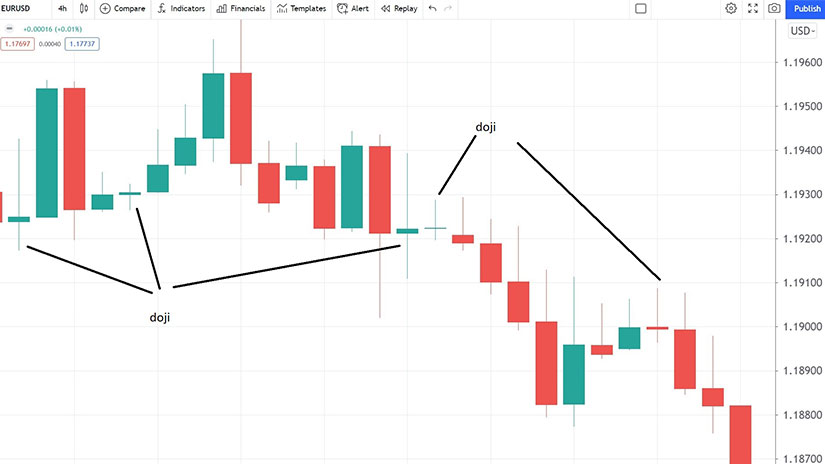
How many candlesticks can we call doji on this chart? Four candlesticks respect the rules of a doji candlestick.
Rules for a Doji Candlestick
 Judging by its original definition, a doji candlestick should not have a real body. Because the opening and closing levels should be identical, there should be no color on the real body. But that is close to impossible in today’s FX markets. Therefore, a small real body does exist, and it can be either bullish or bearish, green or red.
A doji candlestick must have both upper and lower shadows. Depending on the length of the shadows, different types of doji candlesticks exist.
Different Types of Doji Candlesticks
 If we have a look at the chart above we see that the five doji candlesticks have different real bodies as well as different shadows. From left to right, the first doji candlestick has a huge upper shadow – that is called a Southern doji. If the doji candlestick has a huge lower shadow, it is called a Northern doji.
Another type of doji is the so-called “rickshaw man”. The rickshaw man has equal shadows, but longer than usual. Typically, the price action that follows after the rickshaw man is more powerful than after a regular doji candlestick. The third example on the chart above is a rickshaw man.
Doji as a Continuation Pattern
 As mentioned earlier, a doji candlestick shows hesitation. In other words, the market pauses, waiting for some pending news or simply preparing for the next leg.
The difference between the doji candlestick and most of Japanese candlesticks is that the doji candlestick can act as both a continuation and a reversal pattern. But most of the Japanese candlesticks act as reversal patterns, such as the morning and evening star, the hammer, the piercing and dark-cloud cover patterns, and so on.
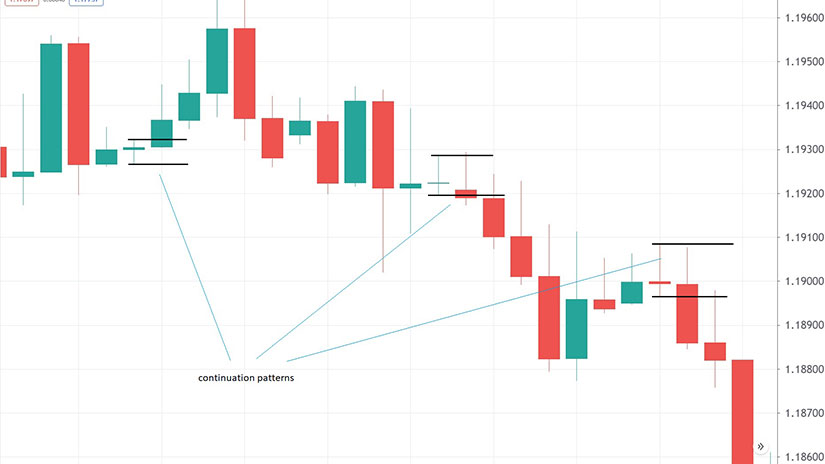
All doji candlesticks presented so far acted as continuation patterns. In other words, the market resumed the trend after the doji candlestick formed.
Sometimes the market tests the opposite direction before the trend resumes. For this reason, the best way to interpret and trade doji candlesticks is to wait for the market to close above or below the upper, respectively lower edge of the doji. Next, place a stop at the opposite edge and use a risk-reward ratio of 1:2 or 1:3 to set the take-profit level.
Doji as a Reversal Pattern
 One cannot say which doji candlesticks form more often – continuation or reversal ones. But traders are more inclined to pay attention to doji candlesticks that form as reversal patterns.
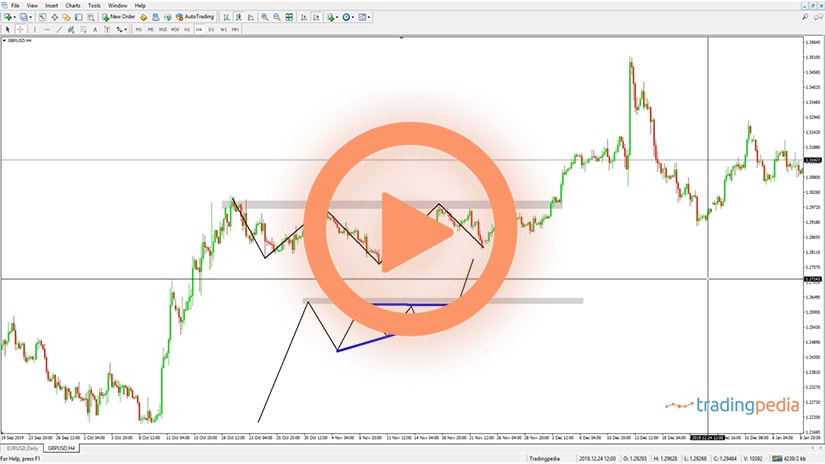
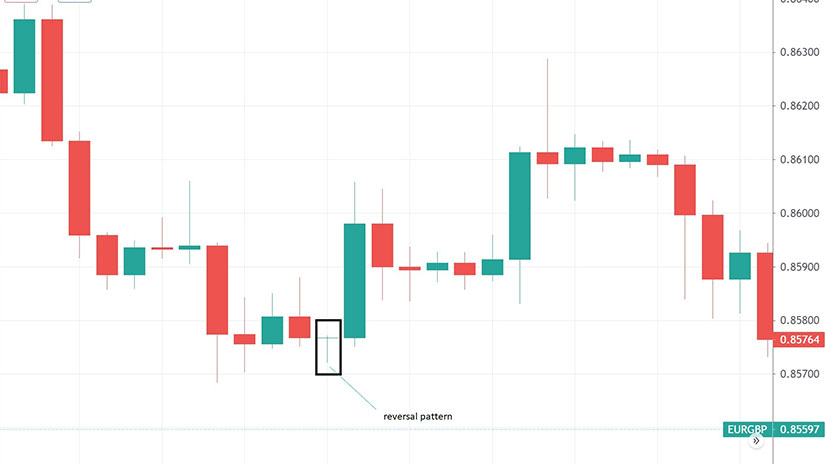
Below you can find the EURGBP 4h chart. It shows a small doji candlestick that acted as a reversal pattern and the market rallied more than fifty pips after it broke above the upper edge of the doji.
Advantages of Doji Candlesticks
 Just like the hammer pattern, the doji pattern requires the interpretation of only one candlestick. In other words, the main advantage of the doji pattern is the fact that it is not time consuming, like the patterns belonging to classic technical analysis.
Where to Expect Doji Candlesticks
 Doji candlesticks appear as both reversal and continuation patterns. When part of confluence areas or when combined with other patterns, they send an even more powerful message.
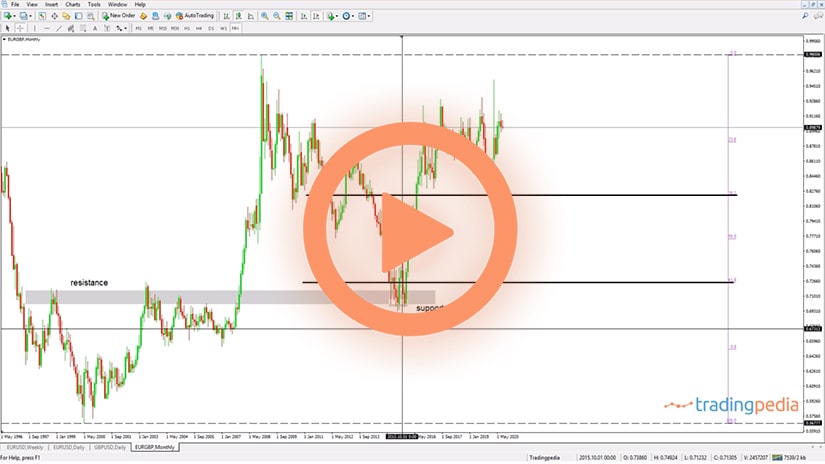
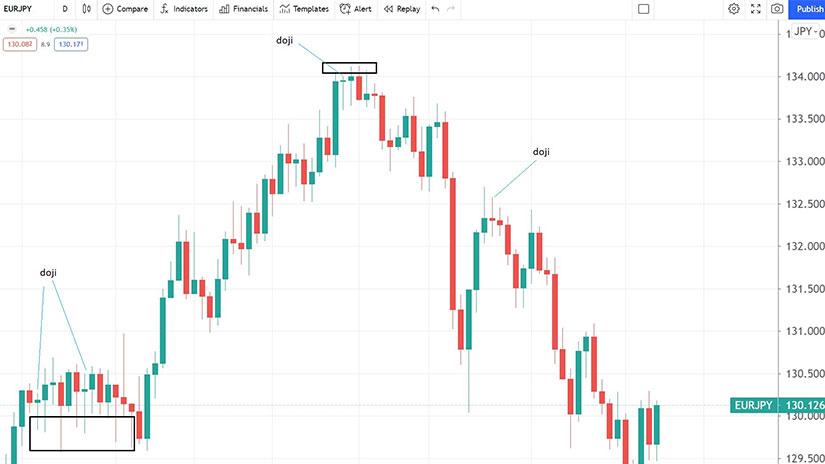
For example, the chart below shows two areas where the price found support, respectively, resistance. From left to right, the support area shows multiple candlesticks having big lower shadows, suggesting buying pressure on any attempt for the market to move lower. If one or more doji candlesticks appear in such an area, the support is likely to hold.
A doji candlestick that acts as a reversal pattern may or may not form at the absolute bottom or top. Some other candlesticks, as seen above, might make new highs, but the doji candlestick shows hesitation moving forward. Traders should always keep in mind that the most important thing when interpreting a doji candlestick is to wait for one candlestick to close beyond the doji’s edges before going long or short.
Doji candlesticks send a stronger message when part of other patterns. For example, a morning star is a reversal pattern that forms at the bottom of a bearish trend. It signals a possible bullish reversal and it is formed out of three candlesticks.
Typically, the candlestick in the middle has a small real body, which can be either bullish or bearish. But the candlestick can also be a doji, and that is a more powerful morning star than otherwise would be the case.
Or, when one or more doji candlesticks form during the right shoulder of a head and shoulders pattern, they often reinforce the reversal pattern. In other words, the market is ready to end the consolidation and will likely head toward the neckline.
To sum up, doji candlesticks are single-candlestick reversal or continuation patterns. They show hesitation and the best way to interpret and trade them is to wait for one future candlestick to close beyond the doji’s edges before entering a trade.