
Hello there, this is tradingpedia.com and this video deals with rising and falling wedges. These are classic technical analysis reversal patterns, as they form at the end of bullish, respectively bearish trends.
Rising and falling wedges
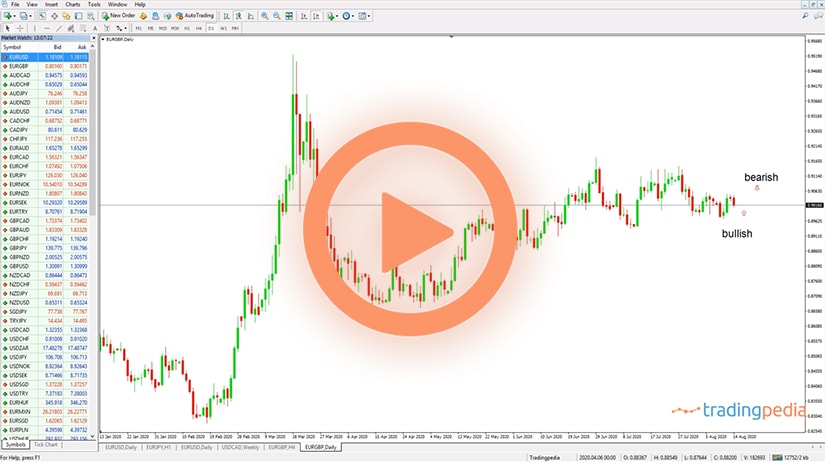
 Rising and falling wedges are powerful patterns – a rising wedge is always falling, is a bearish pattern, and a falling wedge is always rising, is a bearish pattern.
A rising wedge looks like this – the market is in a bullish trend, and then suddenly it begins forming a series of marginal highs only, before eventually reversing. This is called a rising wedge, and to interpret it correctly you must connect the marginal highs and the higher lows, and it looks like this. The opposite is true in the case of a falling wedge.
2-4 Trendline
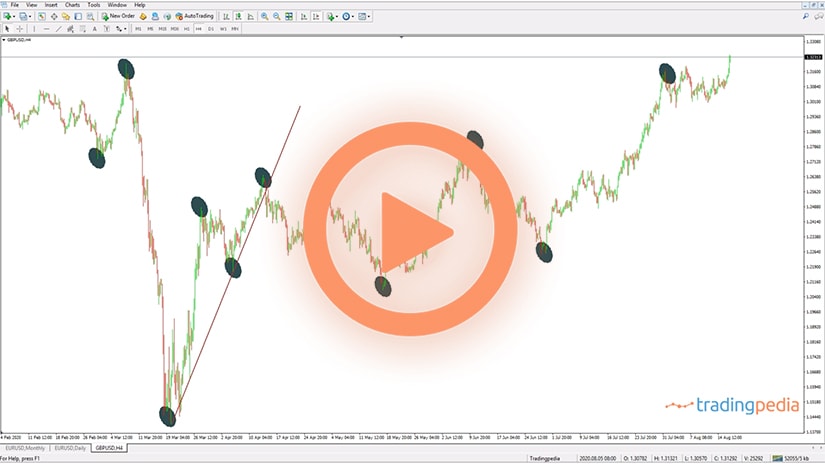
 To trade them, the ideal way is to wait for the lower edge to break. This is also called the 2-4 trendline if you are to label them as 1,2,3,4,5. Very often the price action in the 5th segment pierces the 1-3 trendline – that is something you want to see in such a pattern. Then the market breaks lower and it often retests the 2-4 trendline.
It usually reverses 50% of the entire wedge, and often 100% of the entire wedge. How to trade it? Well, this is the entry price, you must put a stop loss at the highs, let’s make it of a different color, this would be the entry – this is the risk, and this is the reward. If you go for the 50% retracement, that would be more than 1:2 or 1:3 risk-reward ratio, more than enough and if you go for the 100% retracement, then money management would be even better.
Stop Loss
 Why it is mandatory to have a stop loss at the highs in a rising wedge or at the lows in a falling wedge? The answer comes from the fact that these patterns sometimes do not work. They do not work in the sense that sometimes the market forms a so-called running triangle, that looks like a wedge, but in reality, after breaking the 2-4 trendline, the market fully reverses and continues aggressively in the opposite direction. So a stop-loss is mandatory.
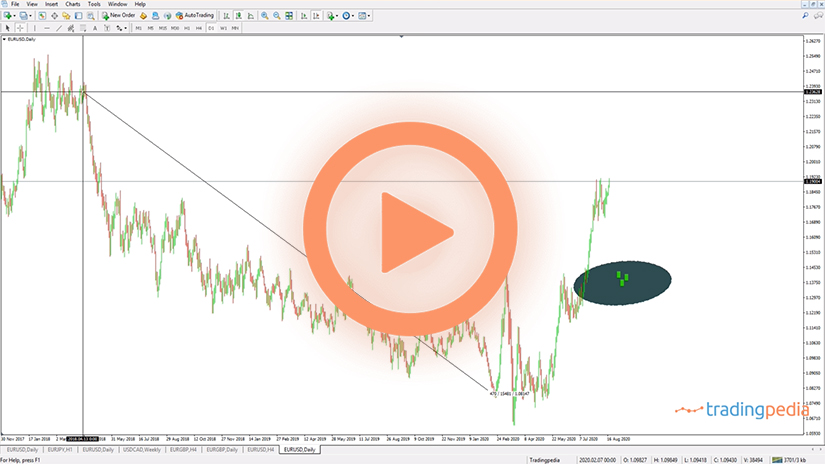
This is an example of a rising wedge, but on this chart, we see an example of a falling wedge. If we apply the same principles as discussed here, we see that the market, when dropping from 1.24 to 1.19, it formed a series of marginal lows and lower highs. If we connect these one – imagine five points here – we see that the fifth segment pierces the 1-3 trendline is a good sign that you want to see. The entry on the long side comes by the time that the price breaks the upper edge of the falling wedge and the stop-loss is mandatory to be at the lows.
This is the risk and you can define the reward in many ways. The 50% retracement provides for more than 1:4 or 1:5 risk-reward ratio. The 100% retracement of the wedge it exceeds the wildest expectations as the market climbed higher in a bullish trend and made a new high. On the two wedges, this is the trade on the long side, this is the trade on the short side. In this case it also retested a bit the trendline, which is something that happens often.
Addition
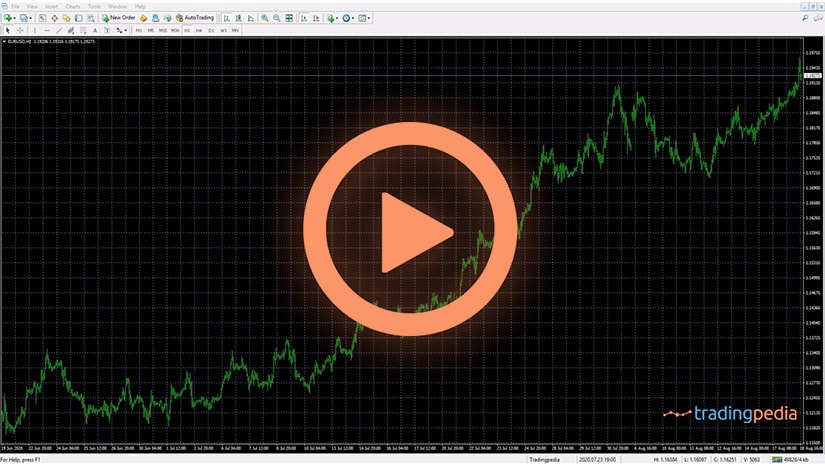
 One more thing on wedges – typically when the market forms such a pattern, either at the bottom or the top of a trend, the series of lower lows or higher highs forms in a divergence with an oscillator. If you use an oscillator, like the Relative Strength Index (RSI), and so on, it is very likely that the price will diverge from the oscillator.
If we apply the RSI, like this, we see that the RSI is on the rise, but the price keeps falling. This is a bearish divergence. It is risky trading bearish divergences because the market may keep forming lower lows and the RSI may keep showing a divergence. But if you use the divergence as only a confirmation to trade the falling wedge, then you simply wait for the price to break the 2-4 trendline before going long, because it means two things. First of all, the divergence ended, and second of all, the falling wedge ended as well.
Related Videos
Look for a series of lower lows and higher highs in a falling wedge or a rising wedge, wait for the price to break the so-called 2-4 trendline, there are five segments in a wedge, and the price typically pierces the 2-4 trendline.
Go short after a rising wedge and long after a falling wedge by the time that the price breaks the 2-4 trendline, place a stop-loss order at the top of a rising wedge or at the bottom of a falling edge, and target 50% of the entire wedge or 100% for magnificent risk-reward ratios.
Tips and Tricks To Consider
 A wedge is a reversal pattern. This is the classic interpretation of the pattern, as a rising wedge forms at the tops and a falling one at the bottoms.
While the statement is true most of the time, some exceptions do exist. Sometimes, the price breaks lower after a rising wedge or higher after a falling one, and then reverses sharply once again.
Such behavior is uncommon but still appears on the currency market. Here are some things to consider when trading wedges:
Stops
- Always have a stop at the bottom of a falling wedge or the top of a rising one. If the price action is strong enough to reverse beyond those points, the new trend is even more powerful than before.
Retests
- The price action typically retests the breakout point in a wedge. After a rising wedge formation, the price action usually retests the breakout point. In a falling wedge, the breakout point is the upper trendline, while in rising wedge, it is the lower trendline.
Three lower lows/ higher highs
- A wedge is characterized by five points. In a falling wedge, three of them establish lower lows, while in a rising wedge, three points establish higher highs.
Pros and Cons of Trading a Rising or Falling Wedge
 One of the main advantages of trading wedges is the fact that they are responsible for generous risk-reward ratios. A risk-reward ratio acceptable in financial trading exceeds 1:2. It means that for every dollar invested, the trader stands to make two.
Anything beyond the 1:2 risk-reward ratio is outstanding. Well, rising and falling wedges can deliver risk-reward ratios much bigger than 1:2. The retest of the breakout point is responsible for such ratios, as traders fade the move and so the risk decreases while the reward increases.
On the flip side, rising wedges are time-consuming. This is one major drawdown of many classic technical analysis patterns such as the head and shoulders or the flag.
How to Trade a Wedge
 Trading a wedge is fairly simple if traders follow a set of rules. Besides what is known, it is wise to consider the time element as well as it is often a good indicator of what is about to come after the wedge’s formation. Let’s have a look at the EURJPY chart, using a step-by-step approach.
An Example on the EURJPY Chart
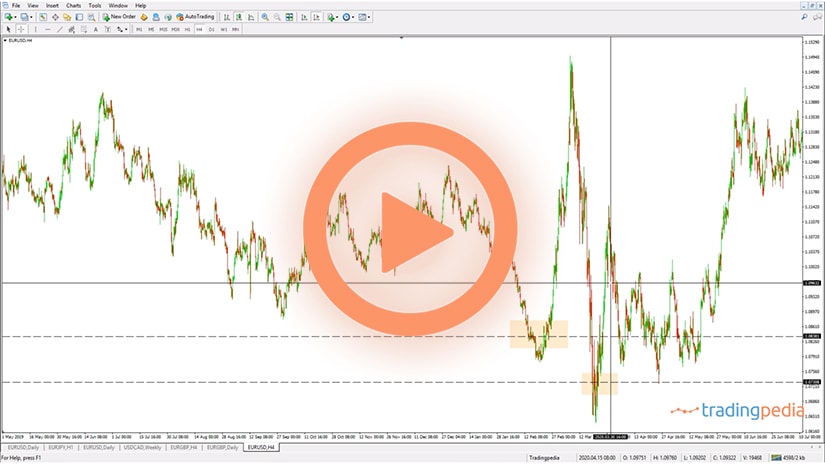
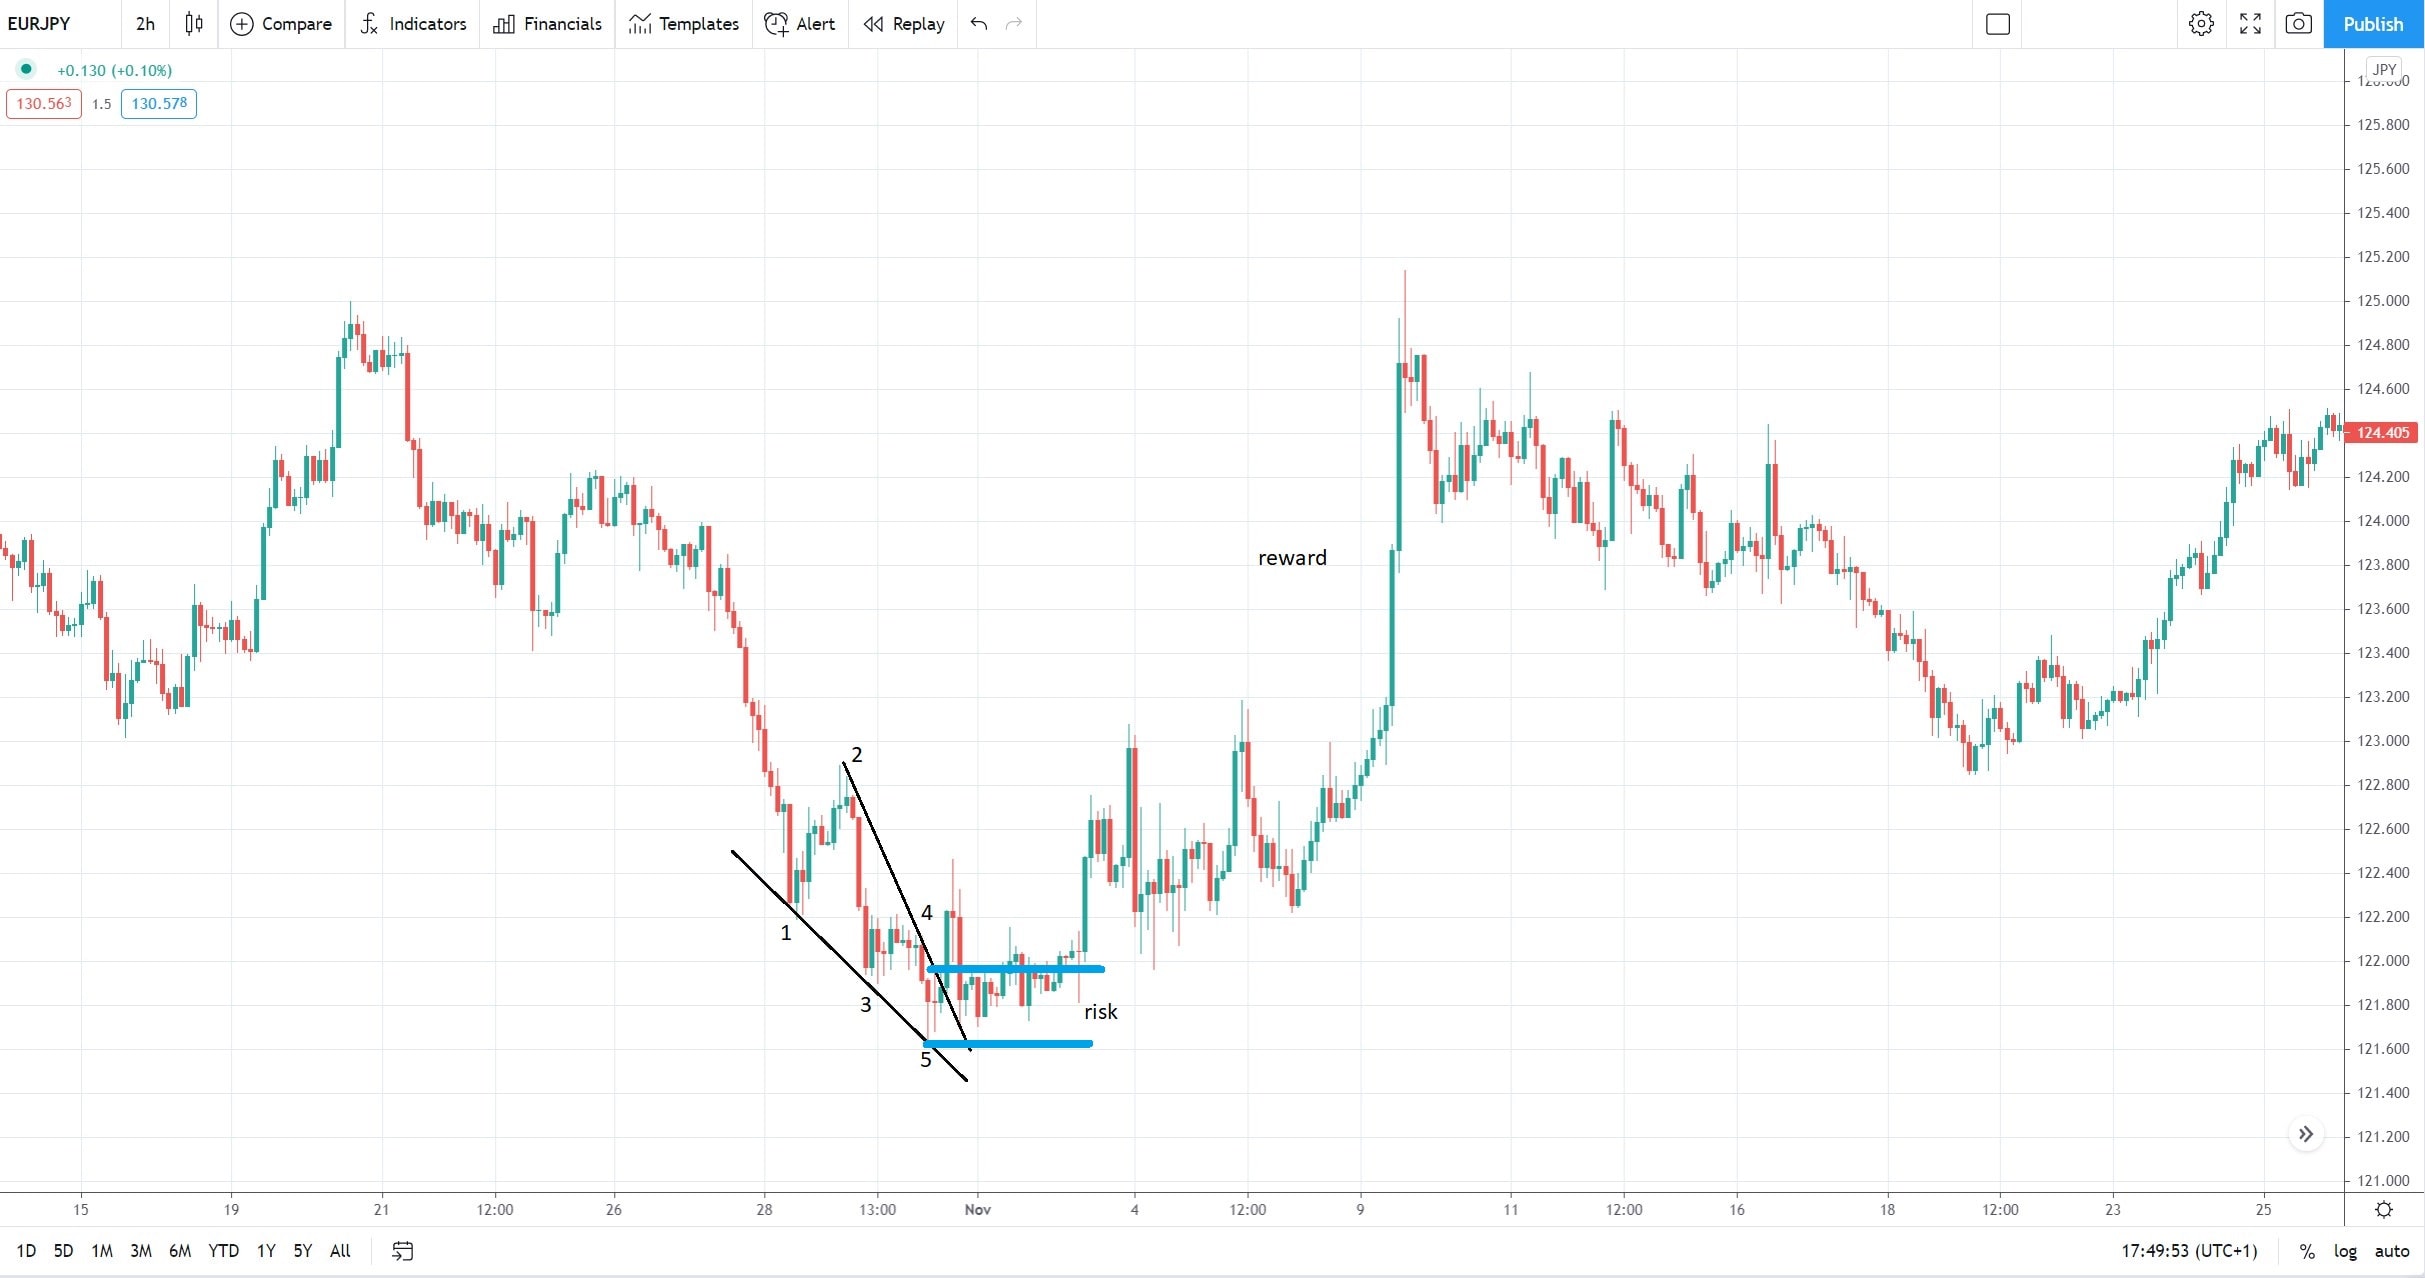
 The EURJPY chart below shows a falling wedge pattern. The market forms a series of lower lows, three of them, more precisely, and then it turns and breaks the upper edge.
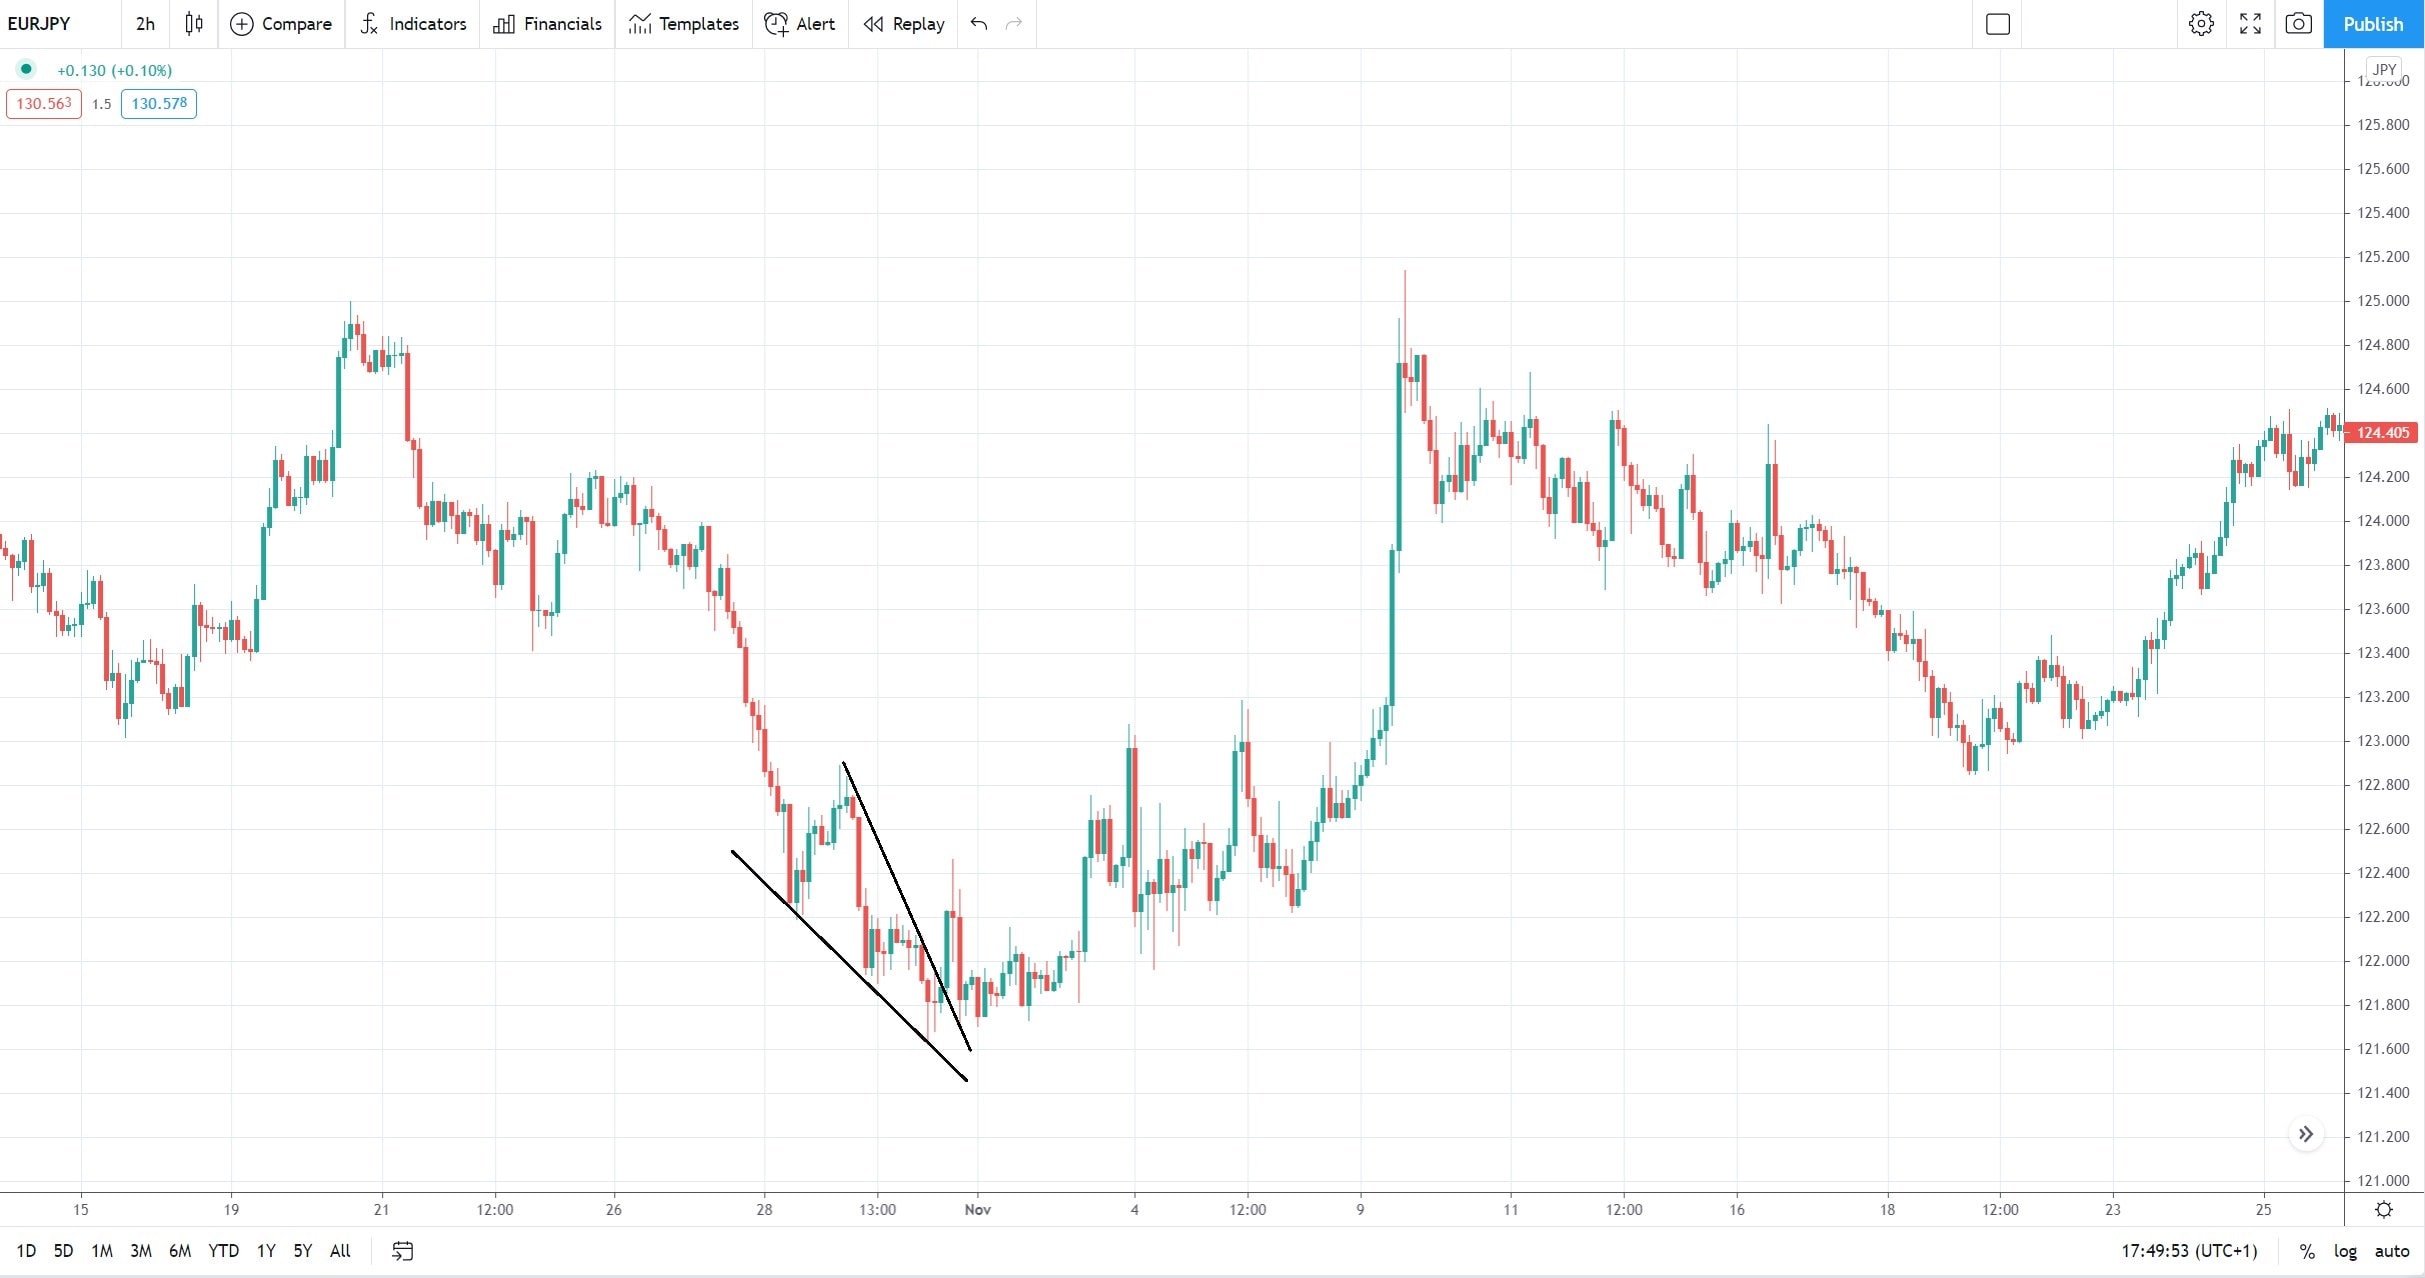
We should mention a couple of things regarding the falling wedge seen above. First, the third lower low briefly touches the lower trendline. While not mandatory, the fact the price pierces the trendline before reversing is normal. In fact, some traders choose not to trade patterns that do not present such a behavior.
To help to understand a wedge formation, traders use numbers to label the series of lower lows and higher lows, characteristics for a falling wedge. If you want, the numbers simply count the market swings.
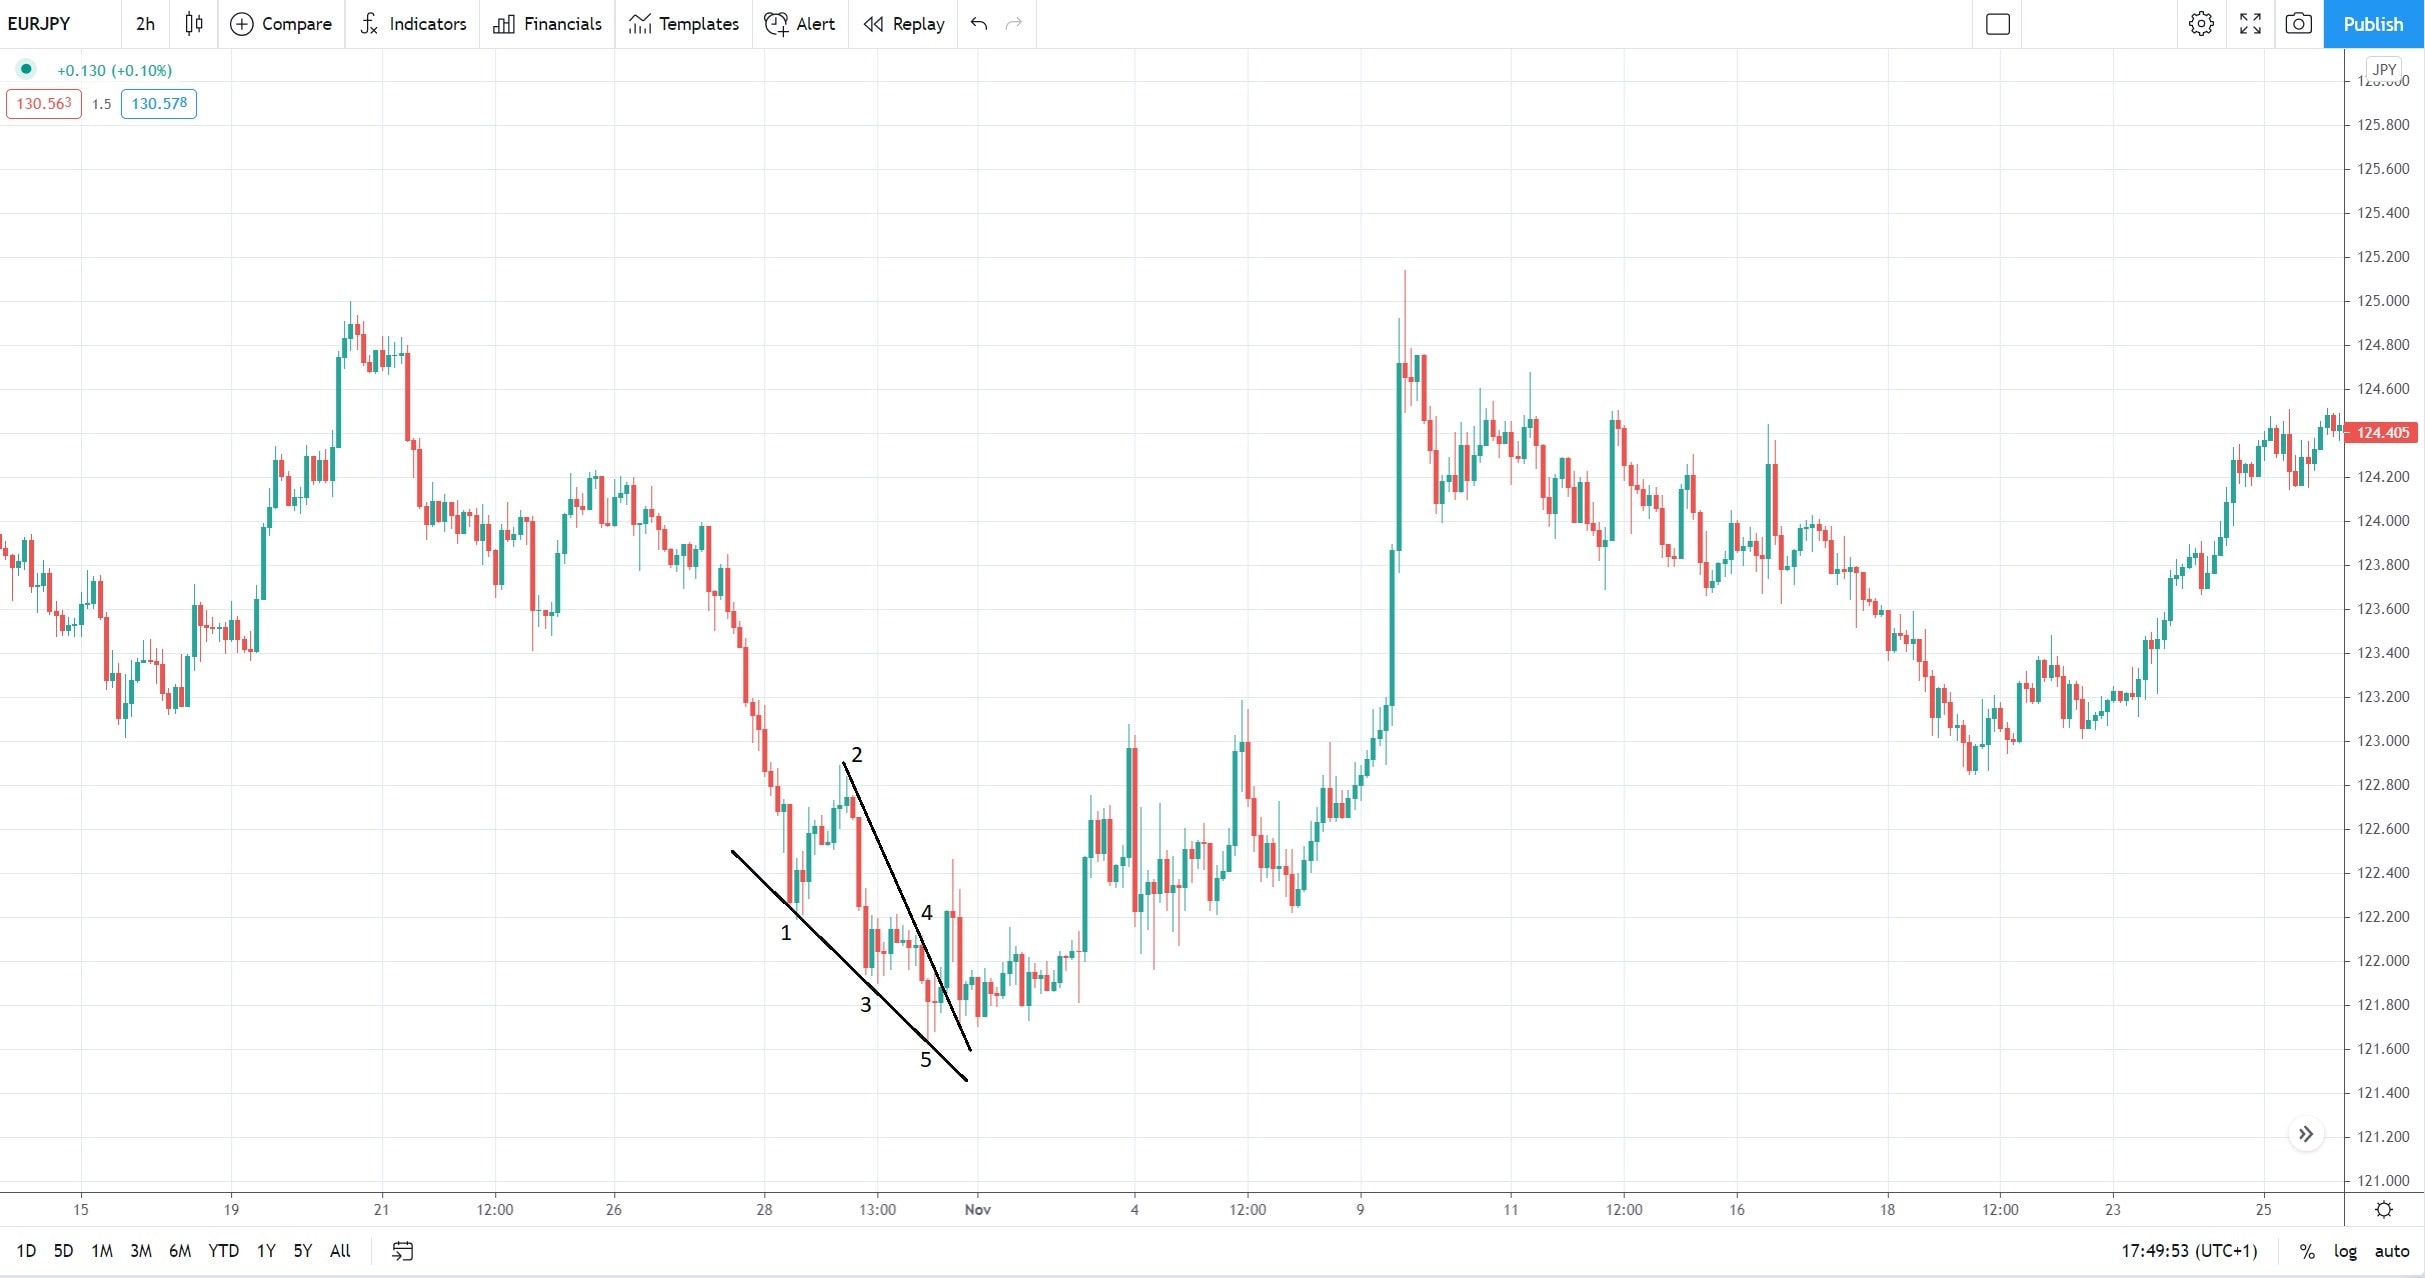
By using numbers, technical traders can better define the two trendlines. Suddenly, it becomes obvious that the focus sits on the 2-4 trendline. It is this trendline that the price must break on a reversal.
Also, as mentioned a bit earlier, if the price action is bearish enough to pierce the 1-3 trendline during the 5th swing, that is a good omen for the falling wedge. Finally, we may say that between the two trendlines, the 2-4 is more important than the 1-3 one.
Setting the Risk-Reward Ratio
 By using risk-reward ratios bigger than 1:2, traders have better chances of growing a trading account. For example, a successful trade having a 1:2 risk-reward ratio allows for two consecutive losing trades without the original balance to decline. Therefore, the bigger the ratio, the more performant the money management system.
The following steps show how to set the risk-reward ratio. First traders should wait for the price to break and close above the 2-4 trendline.
A close below the trendline is mandatory, not optional. If the trendline is only pierced, it is not enough to trigger a buying signal.
Second, traders should wait for the price to retest the 2-4 trendline. If it fails to do so, the signal should be ignored because it hurts the size of the risk-reward ratio.
Third, on a retest, traders would want to go long, placing a stop-loss order at the lowest point in the falling wedge. Typically, that point forms during the last lower low or the last swing that pierces the 1-3 trendline.
Fourth, the reward must be set beyond 50% retracement of the entire wedge. Aggressive traders aim even for full retracement, as the market often does so.
In both cases, the risk-reward ratio is much bigger than 1:2, reflecting why wedges are so powerful reversal patterns.
Using the Time Element When Trading Wedges
 One way to test the validity of a pattern is to use the time element. However, price and time analysis cannot be used on all patterns, so the ones that permit it to have an advantage over the others.
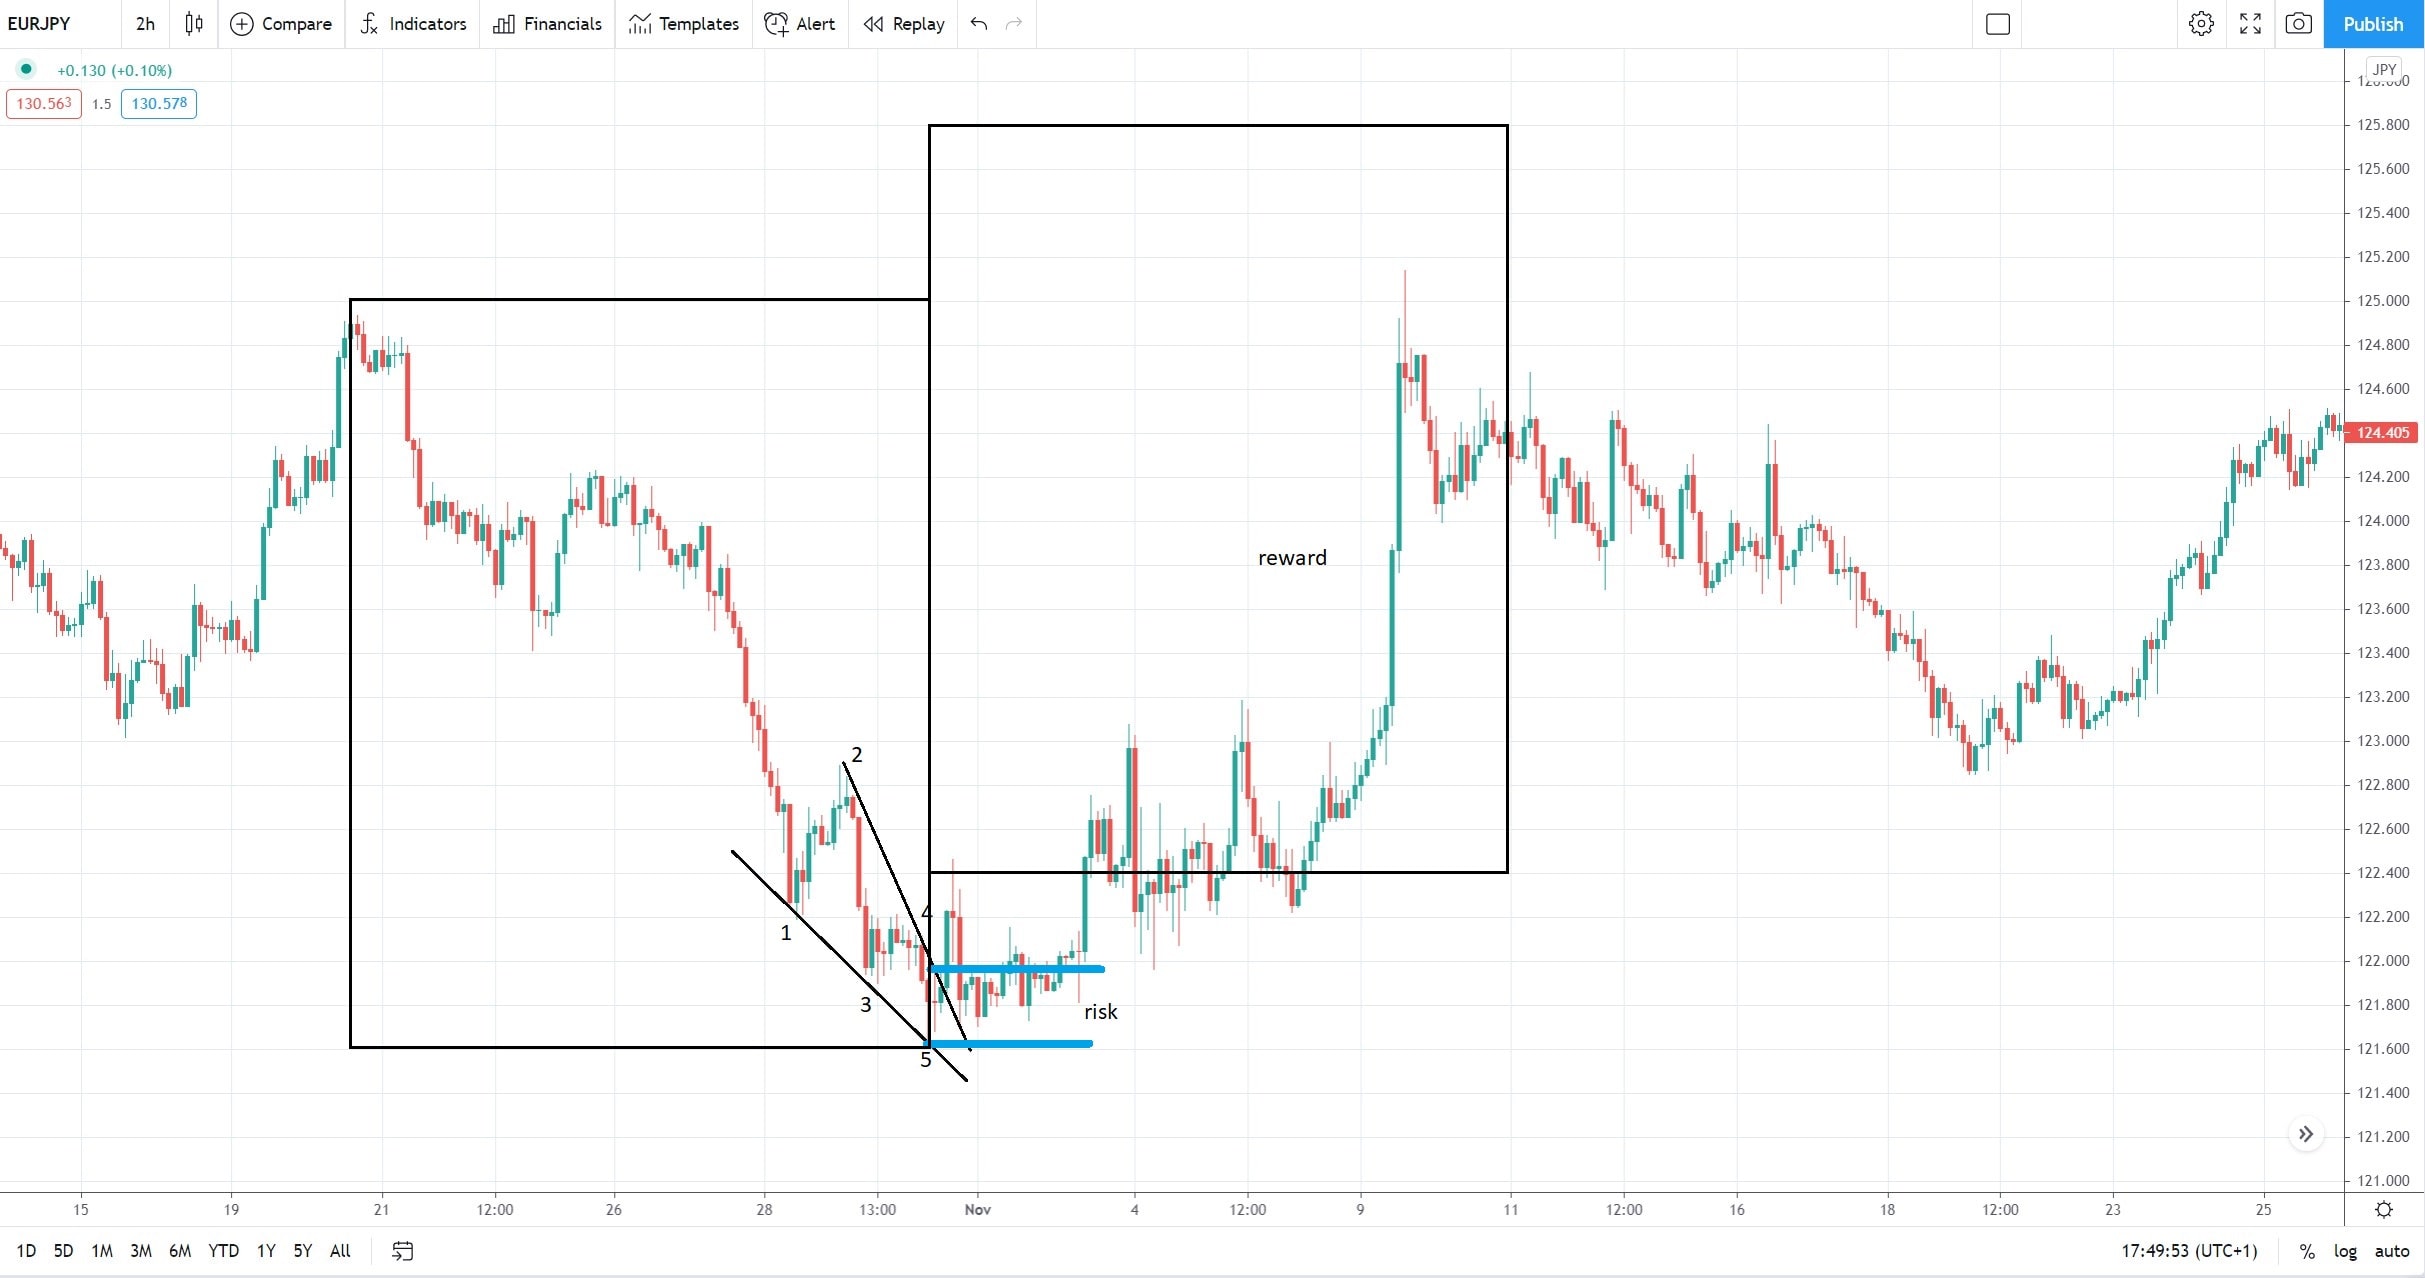
In the case of a wedge, traders measure the entire time it took the wedge to form and then project the time on the right side of the chart. The rule says that the market must fully retrace the wedge in less or the same time in order for the wedge to be confirmed by the price action.
It was confirmed in the example from above. If the time expired and the price action did not fully retrace the wedge, traders should close the long trade as the pattern got invalidated.
We used a falling wedge, a bullish example, but all the rules apply in reverse when a rising wedge forms. Only that traders look to short the market, expecting lower prices.