
Hello there, this is tradingpedia.com and this video deals with another Japanese candlestick pattern, a reversal pattern – how to trade evening and morning stars.
Evening and Morning Stars
 Evening and morning stars form at the end of bullish, respectively bearish trends, and are important reversal patterns because it takes only three candlesticks for the market to reverse. They generate incredibly generous risk-reward ratios, helping traders to better manage the trading account.
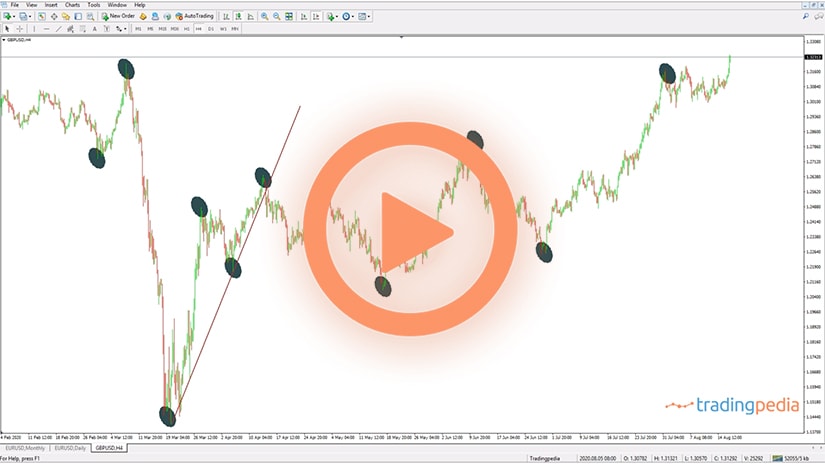
This is an evening star, forming at the top of a rising trend. This is the gold market on the 4h chart and it forms at the end of a bullish trend. Ideally, we should avoid the daily chart when it comes to trading evening or morning stars because if the broker shows the Sunday candlestick you will always have a small candlestick as required for the evening or morning star. So, use the 4h chart or the hourly chart or even the weekly chart as the principles are the same.
Bearish Pattern
 For a bearish pattern, you need an aggressive market trend, a rising market. The first candlestick in the pattern is a strong candlestick, having a strong, bullish, green real body. The real body, remember, is the difference between the opening and closing price. Then the market forms a candlestick that has a very small real body.
The color of the real body, green or red, bullish or bearish, doesn’t really matter. What matters is that the real body is small. The upper and lower shadows don’t matter as well. This one here looks like a rickshaw Doji, it could be a Doji or a shooting star, and so on. And then another candlestick appears, the opposite when compared with the previous one and reverses more than 50% into the territory of the previous candlestick.
How to Trade the Evening Star
 These three candlesticks form the evening star pattern and to trade an evening star we need to follow these steps. We measure the distance between the highest and lowest point in the evening star. Next, we use the Fibonacci retracement tool to find out the 50%-61.8% retracement – that would be the entry.
Because this is a reversal of a rising trend, it shows a battle between bulls and bears. Bears, eventually, win, but bulls will not give way that easy. The market will almost always try to take the highs and fail. Sometimes it doesn’t fail, but this is why we use a stop-loss order and appropriate risk-reward ratios. What does it mean?
If we enter at 50% retracement, this is the risk, and then we project the risk to the downside to find out the reward. A risk-reward ratio that exceeds 1:2, meaning that this is the risk, and this is the projected reward, is already considered appropriate. 1:3 or 1:4 is something spectacular.
Imagine that the price reverses and takes the stop here. That is OK, because on the next trading setup, the market may not take the stop and may travel with a 1:3 or 1:4 rr ratio. For instance, what does the market do at the bottom here? There is no reversal pattern, maybe a hammer here, and there is no reversal pattern at the top as well.
How To Trade The Morning Star
 However, we see here that the market moves lower and forms a morning star this time. We have a strong candlestick with a strong, bearish real body, a candlestick with a small real body in the middle and then another one that follows with a bullish real body that retraces more than 50% into the territory of the first candlestick. This is a pattern we want to trade; this is a morning star.
In order to trade it, we do the opposite. Namely, we mark the lows and the highs in the pattern, we use the Fibonacci retracement tool to find out the 50%-61.8% retracement area and we mark it – that is the entry place.
Let’s consider still the 50% retracement, not the 61.8%, so as to be a bit conservative, so this is the risk. Next, we project the risk to the upside to find out the reward. We see that the market exceeds 1:3 risk-reward ratio as the market keeps going up.
To make the most of these wonderful patterns, consider trailing the stop by the time that the market advances, even though sometimes is not in your advantage, but it could be useful in order to use the capital for other trades. If this trade would not be successful, this one would be successful. The risk or the loss triggered by the stop here would be easily recovered. In any case, the market did not trigger the stop-loss orders, and here you have two examples on how to trade an evening star and a morning star.
Related Videos
Evening and morning stars appear at the end of rising, respectively falling trends. In the first case, we prepare to sell a retracement into 50%-61.8% area. In the second instance, we prepare to buy a retracement into the same area. Next, we project the risk to the downside or the upside, depending on the pattern, to find out 1:2 or 1:3 risk-reward ratios or we can even trail the stop to play it safe.
Practical Examples of Morning and Evening Stars
 Stars are one of the most powerful reversal patterns in technical analysis. They belong to the Japanese technical analysis branch, and their biggest advantage is that they take a short time to form.
Like any reversal pattern, stars need trending conditions to exist before the reversal pattern forms. As such, in a bullish trend, the market must form a series of higher highs and higher lows. If at any one point, the market forms a star as a reversal pattern, that is enough for the contrarian trader to step in.
Stars reflect a contrarian point of view. Because of that, the risk-reward ratios given by trading stars outpace other ratios given by different reversal patterns.
In fact, this is one of the biggest differences between classic technical analysis patterns and Japanese ones. For instance, the head and shoulders’ measured move does not offer a risk-reward ratio sufficient enough to warrant a trade under stringent money management rules.
A star is a three-candlestick pattern. The name tells everything about the future market direction to be expected. As such, an evening star is bearish, suggesting the Sun is setting or coming down, while a morning star is bullish, suggesting the Sun is rising up in the sky.
Because of this simple analogy, a morning star needs a falling trend in place before its formation. Consequently, an evening star needs a rising trend.
What Makes a Star?
 A star is a three-candlestick pattern. Effectively, only three candlesticks are needed to complete the pattern, and then the trader may place the orders to trade it.
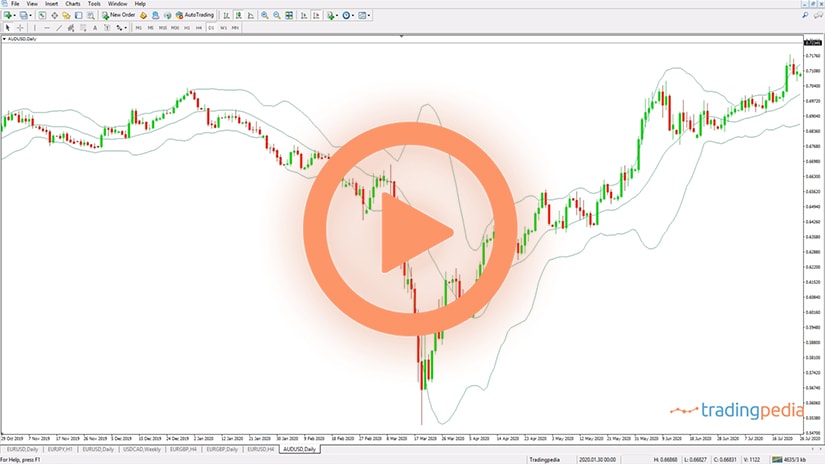
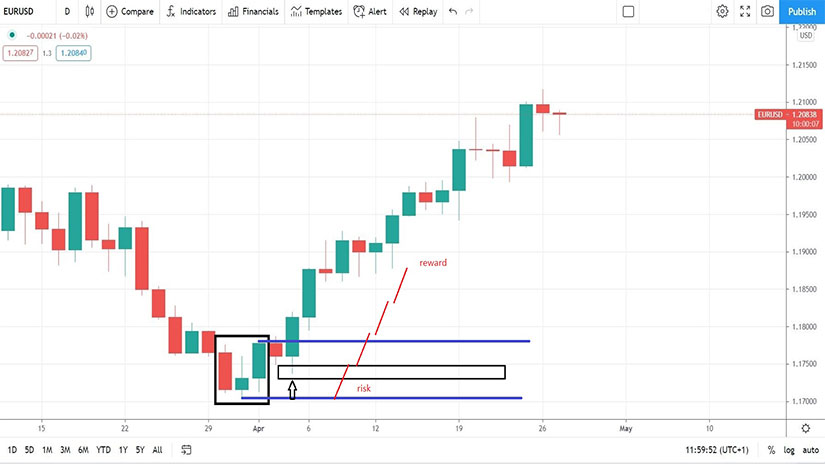
Let’s start with a bullish pattern – the morning star. Below you can see the EURUSD daily chart, bouncing strongly from the 1.17 area in the last couple of weeks. Plenty of fundamental arguments stand behind the EURUSD bounce, such as the European Central Bank (ECB) not delivering more easing as it promised or that the data in Europe comes out better than the market participants expect.
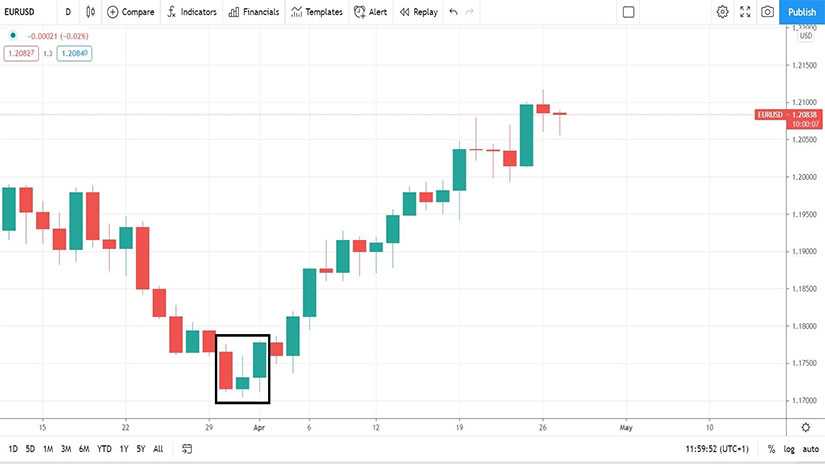
But from a technical perspective, all that matters is what the price action tells us. In this case, the three candlesticks highlighted above are part of a morning star formation.
First, because of the fact that the price action is bearish, the first candlestick in the pattern must be bearish. Typically, this means that its real body (i.e., the distance between the opening and closing prices) is red, as this is the designated color for a bearish candlestick. Also, the first candlestick’s real body is big, compared to the second one. In other words, no one suspects a bullish pattern on the back of the first candlestick alone.
The second candlestick in a morning star formation is either a hammer, a doji, or just a candlestick with a small real body. The real body can be either red or green, bearish or bullish.
Finally, the last candlestick is a strong, bullish one, with a green real body that retraces more than 50% into the territory of the first candlestick in the pattern. By the time the third candlestick closes, the pattern is completed.
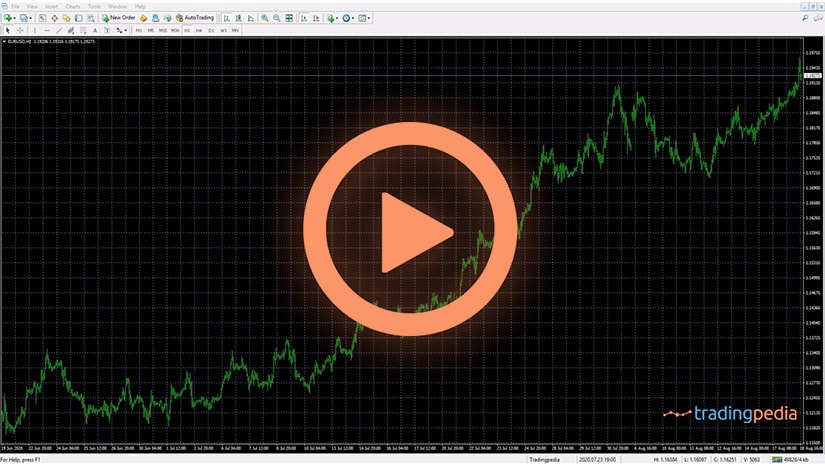
Here is an evening star, this time on the AUDUSD 4h chart. It is just the opposite of a morning star pattern.
How to Trade a Star?
 Trading morning and evening stars follows the same path as trading a hammer. The only difference is that the pattern is made of three candlesticks instead of only one.
The first thing to do is to make sure that all the conditions mentioned earlier in this article are in place. Next, draw two horizontal lines that mark the absolute low and high in the pattern, regardless of the levels are on the first or the third candlestick.
Moving forward, find the 38.2%-50% retracement of that area by using a Fibonacci Retracement tool and measuring between the highest and lowest points. The next step is to place a pending order to buy such a dip, with a stop-loss order at the lows. That is the risk for the trade, and the reward must exceed minimum three times the risk involved.
These are the steps for trading an evening star and are identical to the steps needed to trade a morning star. The only difference is that, instead of buying, traders are selling after an evening star formation appears on a chart.
As the EURUSD daily chart above shows, the risk-reward ratio of 1:3 is easily achieved. In fact, the market continues its bullish trend by the time it reached the target. Aggressive traders may want to participate in the advance and use trailing stop orders that follow the price action. Or, conservative traders may want to book half of the profits by the time the market reaches the 1:3 target, raise the stop-loss order at break-even, and then keep the other half for more upside.
There is one thing in this chart that we must pay attention to – the pullback after the morning star’s formation.
What If There Is No Pullback?
 Not all stars are followed by a pullback into the buying or selling area. Sometimes the price action is so strong that the market is not forming any pullback. Is this still a pattern to trade?
The quick answer is no – the pattern should be skipped. While all the conditions named in this article are valid, without the pullback into the 38.2%-50% area, the trader will have a hard time achieving the desired risk-reward ratio.
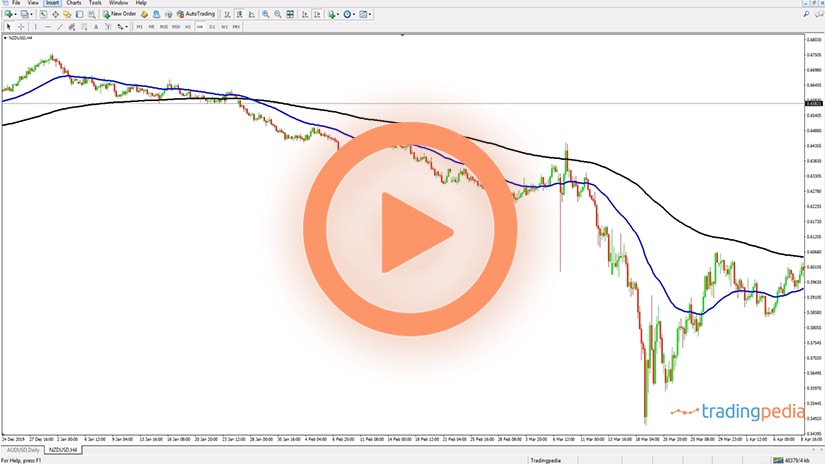
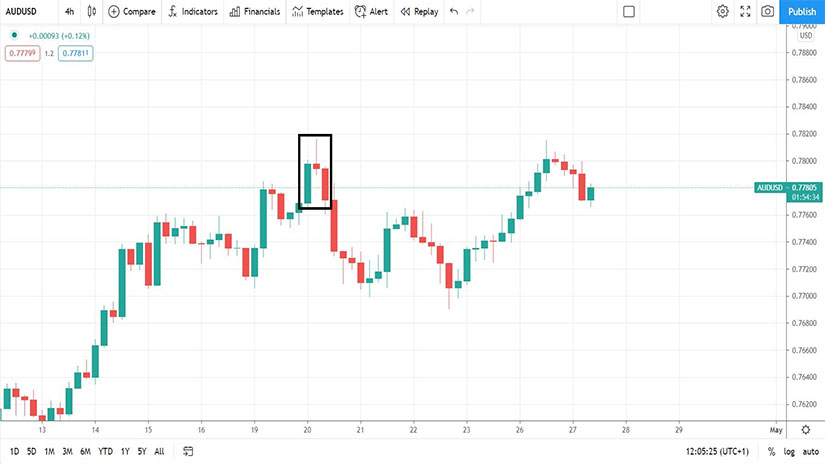
Have a look at the chart below. It shows the AUDUSD pair on the 4h chart and a perfect evening star formation.
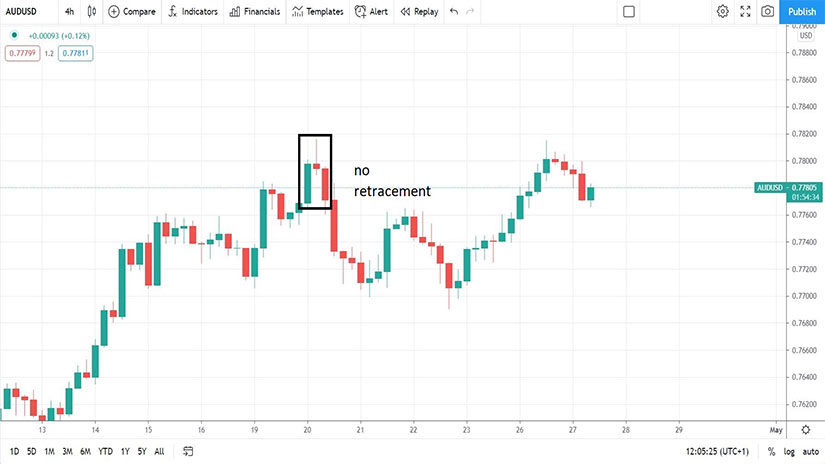
The market did decline after the evening star completed, but there was no pullback whatsoever. Because of that, the risk-reward ratio of 1:3 was not reached, and, eventually, the market reversed. Hence, the best way to approach such a situation is to simply ignore trading morning or evening stars that are not followed by a market pullback. Discipline is key when trading technical patterns and a proper risk-reward ratio is key for success in the long run.