
Hello there, this is tradingpedia.com and this video introduces the Elliott Waves Theory to you. It is one of the most wonderful and powerful trading theories ever invented. It was introduced for the first time in the 1930s by a guy named Ralph Elliott, in the United States.
The Elliott Waves Theory
 This guy was an accountant and had nothing to do with the stock market. At one point in time he fell ill, and he was forced to stay in house. He studied the stock market and noticed that some patterns came and went consistently. He put the patterns together and developed a theory known today as the Elliott Waves Theory.
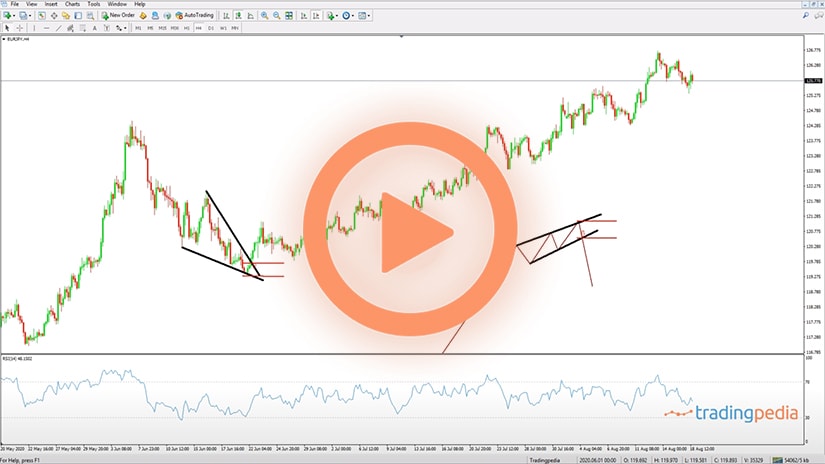
Before anything, it is worth mentioning that the theory was developed on the stock market, but its principles were expanded to any market that moves, like this one here. This is the EURUSD and any market can be subject to Elliott Waves analysis.
This is a vast theory, one of the most complex ever created. It is impossible to be presented in only one video, and this is the reason why this video introduces the concept to you and what Elliott wanted to say and prove almost a century ago.
According to the Elliott Waves Theory, the market moves in cycles. Therefore, you will have a move to the upside, followed by a move to the downside. In other words, the action, and the reaction to that market move. Or a move to the downside is always followed a reaction. So you have a bearish trend, and a reaction.
This is called a cycle with the Elliott Waves Theory and Ralph Elliott identified many cycles – grand cycles, super cycles, minuets, and so on. Different cycles of different degrees and each cycle looks like this. It is formed out of an impulsive move, or a five-wave structure, labeled with numbers – 1,2,3,4,5. So this move to the upside is impulsive, labeled with numbers, and we can put it like this – 1-2-3-4-5.
Impulsive Wave
 An impulsive wave has many rules and we won’t discuss them here. But it is important to note that an impulsive wave is labeled with numbers and any impulsive wave has five waves of its own.
Out of those five waves, the first, the third and the fifth one is impulsive as well, but of a lower degree. In other words, this 3rd wave should be an impulsive wave but of a lower degree. Let’s illustrate it with a different color – 1,2,3,4,5. This is how you understand the different cycles that Elliott refers to.
This 3rd wave here in red is also made out of five-wave structures, and so on. Out of these five waves, the 2nd and the 4th waves are called corrective waves. They are labeled with letters, instead of numbers, and are also called threes as most of them have a three-wave structure or an a-b-c.
A triangle is also a corrective wave, labeled with letters – a-b-c-d-e, but it is also called a three only to illustrate the corrective character of those segments.
What follows after a five-wave structure is an a-b-c of the same degree. That would be a, that would be b, that would be c. This is called a cycle with the Elliott Waves Theory and this cycle contains an impulsive and a corrective wave. This is the corrective wave, and this is the impulsive wave.
The theory goes beyond such simplicity in the sense that corrective waves are simple or complex. Simple ones are flats, zigzags, triangles. Complex corrections are double or triple combinations, double or triple flats, running corrections, horizontal corrections, and so on.
Impulsive waves are of multiple types as well. You have third wave extensions where the third wave is the longest, fifth wave extensions, double extended impulsive waves, or terminal impulsive waves. All these types of patterns have different rules and add to the complexity of the Elliott Waves Theory.
Important Things
 What is important to know at this point with this introductory video is that, more or less, this is a cycle with the Elliott Waves Theory, and such a structure may be, for instance, the first wave in an impulsive wave of a bigger degree. Imagine here a first wave, let’s make it a bit bigger and of a different degree; this may be the second wave.
Then, what the trader does is forecasting the third wave’s length. Of, this cycle here may be the a-wave of a zigzag pattern and this may be the b-wave of a zigzag pattern and then what the trader does is to forecast the c-wave of that zigzag.
The beauty of the theory is that it allows you to forecast a future market move while keeping a tight money management control. You will always know where the market goes if you do your homework correctly. However, it has some drawdowns.
One of the major drawdowns is that counting waves with the Elliott Waves Theory is time consuming, it requires a top/down analysis from the yearly and monthly charts to the daily and four-hour charts, constantly updating the price action and that takes time.
Related Videos
This introductory video, remember that a cycle with the Elliott Waves Theory is formed out of an impulsive wave, five-wave structure, and a corrective wave, a three-wave structure. Multiple cycles of various degree exist.
What Is an Elliott Wave Cycle
 The Elliott Waves Theory was first built on the stock market in the 1930s. Ralph Elliott believed that the market forms certain patterns, that keep repeating.
An assumption of the Elliott Waves Theory is that various cycles of different degrees exist. In other words, the market’s behavior on shorter timeframes is similar with the one seen on larger timeframes. The only difference between the two is the Elliott Wave cycle.
The Elliott theory is not the only one that uses assumptions. In fact, technical analysis as a field is based on assumptions, such as the fact that patters keep repeating themselves.
Modern economics tells us that the market is getting more and more close to efficiency. As such, a weak-form efficient market should not allow for abnormal gains based on technical analysis. However, the currency market is too complex for inefficiencies to be completely eliminated. Therefore, if there is a market where the Elliott Waves Theory has a chance of providing solid results in the twenty-fist century, that is the currency market.
What Makes an Elliott Cycle?
A cycle is a combination of one impulsive and one corrective wave. It is very important for the Elliott Wave trader to be able to distinguish between different cycles.
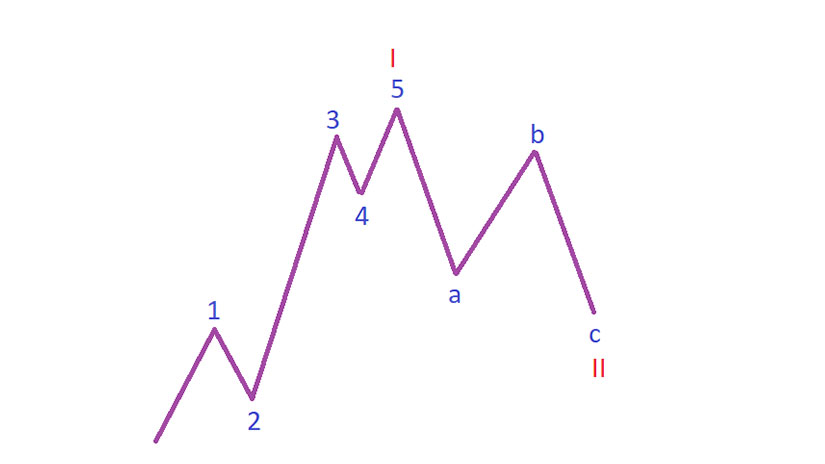
For example, the key to successfully counting waves using the Elliott theory is to know where a cycle ends and where another starts. The image above shows an impulsive wave labeled with numbers, followed by a corrective wave labeled with letters – all in blue.
This is an Elliott cycle: 1-2-3-4-5 – a-b-c. The fact that the waves, both corrective and impulsive, are labeled with the same color, reflects the fact that they belong to the same cycle.
But that is not necessarily true in all cases. In the example above, the five-wave structure completed the first wave of a larger degree (the I in red), and the corrective structure completed the second wave of the same larger degree ( the II in red).
However, it could have been that the five-wave structure ended the fifth wave of an impulsive structure of a larger degree, and that is where the cycle ends. Therefore, whatever follows after that, belongs to a different cycle.
Elliott identified various cycles, from super cycles to minuette ones. The key is to correctly identify them and to use a top/down approach so not to get lost in interpreting the market moves.
Impulsive vs. Corrective Waves
An impulsive wave is always labeled with numbers. But even within an impulsive wave, corrections do exist.
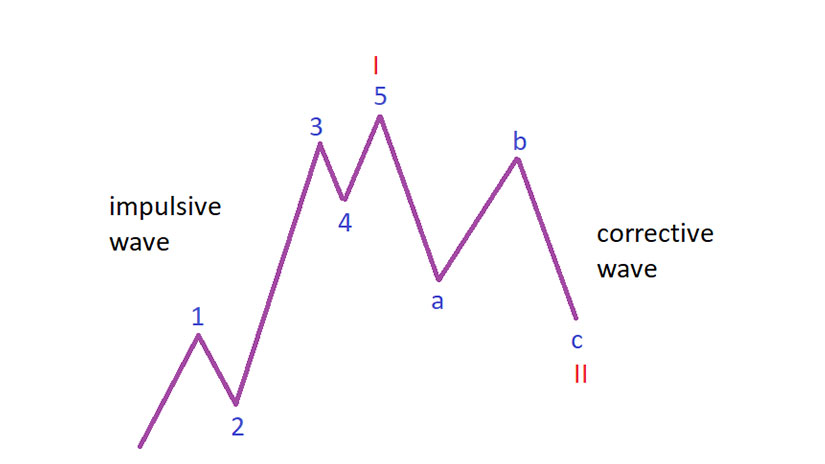
The second and the fourth waves, shown in blue in the picture above, are corrective. Yet, they belong to the impulsive wave. Therefore, understanding impulsive waves is impossible without understanding corrective ones.
We can say the same about corrective waves. In the image above, the a-b-c structure, shown in blue, represents the corrective phase of the cycle.
However, wave c is always impulsive, while wave a may be impulsive or corrective, depending on the correction’s structure. The conclusion here is that impulsive and corrective waves are interconnected and a trader cannot interpret one without knowledge of the other.
Elliott and Fibonacci
 The Elliott Waves Theory is built on Fibonacci ratios. If there is one thing that connects the different pieces of the Elliott puzzle, that is Fibonacci.
Both retracements and expansions are used to set strict rules. In fact, most of the Elliott rules are based on Fibonacci ratios.
One example is shown below. The second wave typically corrects into the territory of the first wave, and most of the times the retracement reaches 61.8% of the first wave.
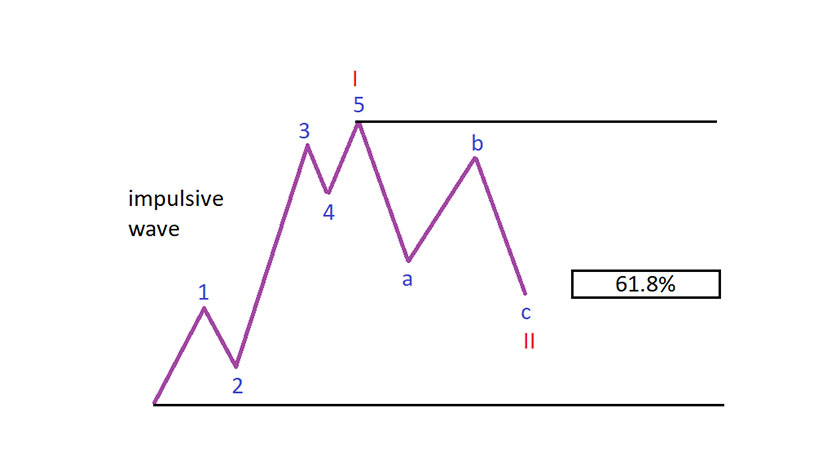
Armed with such information, traders have a setup at hands that often results in impressive risk-reward ratios. To exemplify, imagine that the bullish trader waits for the market to retrace 61.8% after an impulsive wave ended.
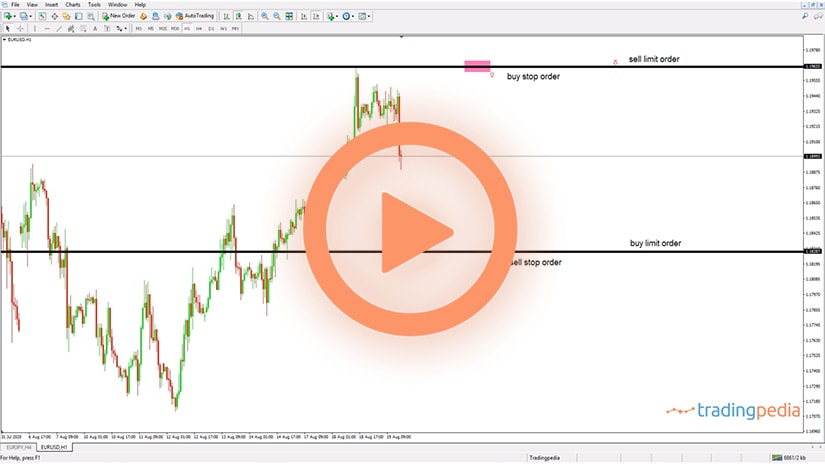
There is no need to wait and trade the move manually – a pending buy limit order may be set, and when the market declines and reaches the entry, the order is executed. This way, emotions are eliminated.
On such an entry, the trader will set the stop-loss order at the impulsive wave’s starting point. One of the strict rules in the Elliott Waves Theory tells us that the market cannot retrace beyond the start of the first wave in the impulsive structure. Hence, such a move would invalidate the scenario.
Next, traders use another Fibonacci tool, this time the expansion tool, to find out the 161.8% projection of the first wave. Finally, they use that projection as the target for the long trade. This way, the Fibonacci ratios helped building a risk-reward ratio much bigger than 1:2, the standard in FX trading.
Top/Down Analyses With the Elliott Waves Theory
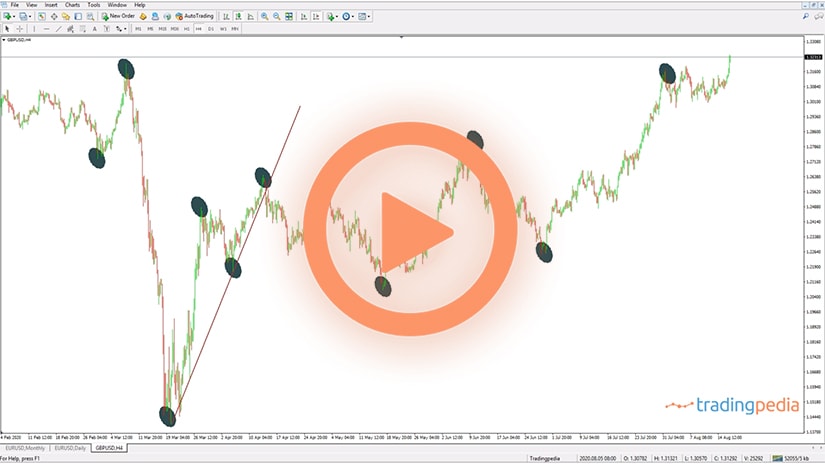
 We cannot end this article without mentioning the importance of a top/down approach with the Elliott Waves Theory. As the name suggests, a top/down approach starts from the larger timeframes and continues with the shorter ones.
But a top/down analysis is not mandatory to start from the monthly timeframe. Only because this is the largest timeframe offered by the broker, it does not meant that previous data does not exist.
Therefore, traders must do some due diligence and invest some efforts in finding out as much historical data on a currency pair as possible. This is valid for every market, regardless what you’re trading – having access to all the data, or to as much data as possible, is key when using the Elliott Waves Theory as the basis of your analysis.
A top/down approach also means that the trader starts with the bigger cycle and continues on the shorter timeframes from where it left. This way, the trader analyzes the entire market, knowing where the market should go and what market move will invalidate the Elliott count.
This is just an introduction to the Elliott Waves Theory, as more articles will follow. The Elliott theory may look as an easy one, but a complete analysis requires many pieces of puzzles perfectly combined to predict the next market move.