
Hello there, this is tradingpedia.com and this video deals with double and triple tops and bottoms, very powerful reversal patterns seen on any timeframe and any market, regardless if it is the stock market or the FX market.
These classic technical analysis patterns are used by traders all over the world and often the market hesitates at such levels. Therefore, a double top or a double bottom form at the end of a rising or falling trend, and look like the letters M or W.
Double Top & Double Bottom
 For instance, for a double top, you need a rising market, and the price is rejected from a horizontal area. Careful here, because a horizontal area in the currency market is difficult to interpret because the volatility is high and you must look at an area where the market tries two times to break it and it fails both times and that will be your market top.
So the market tries, gets rejected, tries again, and gets rejected again, and this is the letter M, the double top. The double bottom, obviously, is the opposite. The market tries at the end of a bearish trend, it bounces a bit, tries again, and then bounces. This is a W. As you can see, the distance between these two attempts is smaller than the distance between these two attempts, telling you that there is a diversity within the two patterns.
The measured move of such a pattern is the distance from the horizontal base until the pullback in the middle, projected from that place higher or lower. This is the minimum distance that the market should travel. It is not mandatory for the market to reverse after reaching these measured moves, but it is mandatory for the market to reach these measured moves. By the time, a double top or bottom is in place, you will often notice that it remains in place for quite some time.
Summary
 We have a couple of examples here on the monthly GBPUSD chart. We had a bounce during the financial crisis and the market bounced and hesitated at this area, forming two highs. How do we place the measured move for the double top? It is not necessarily the measured move that you see in the trading books, but it is the distance that the market traveled here, projected to the downside. I would say that a proper measured move in this case would be this one, projected from the moment that the market broke lower and that will confirm the double top in this area.
Then the market fell aggressively – this was as a result of the Brexit referendum in 2016, it bounced, this was the coronavirus pandemic dip, it bounced, but it bounced from a similar area, raising questions that the market actually formed a double bottom.
Calculating the Measured Move
 How do we calculate the measured move? Well, we take trendline and measure this distance and project it from here and that would be the minimum distance that the market should travel to confirm the double bottom.
Obviously, for any trade you will need a stop loss, an entry, and a take profit. Trading a double bottom on the bigger timeframes is very difficult because you cannot go on the long side here at 1.31 and place a stop loss at 1.14 and targeting much higher. The distance is too big to justify such a trade.
But on a bigger timeframe they are useful to reflect the length and the strength of a trend. For instance here, if we do not trade the double bottom on this timeframe by the time that the double top is confirmed, we can go on the lower timeframes and trade on the short side because a toppish formation is in place.
So even if we don’t trade this move to the upside and the price manages to confirm the pattern, we can trade the bullish trend by following the rules of a bullish trend.
Triple Top or Triple Bottom
 The market may also put a triple top or triple bottom – still against a horizontal line. It is a similar concept with the exception that the market tries for the third time at the same area before reversing. What is important to mention here is that between the double tops and bottoms and triple tops and bottoms, the first ones are more common. Therefore, look for double tops and bottoms to be responsible for stronger market moves than triple tops and bottoms.
Related Videos
I will end up with the fact that the triple tops and bottoms rarely hold. When you see a triple top, even if confirmed, the market usually comes back and makes a new high. Therefore, triple tops and bottoms should be treated with a grain of salt, while double tops and bottoms should be viewed as more important.
Double and Triple Tops and Bottoms – Examples
 As reversal patterns, double and triple tops and bottoms are part of classic technical analysis. Together with the head and shoulders, the rising and falling wedges, or the ascending and descending triangles, double and triple tops and bottoms are one of the earliest forms of technical analysis.
Reversal patterns are trickier to trade and interpret than continuation ones. Because the trader is a contrarian, the risk must be carefully managed when trading reversal patterns. Therefore, a tight stop and a risk-reward ratio bigger than 1:2 are mandatory prerequisites.
Another thing to keep in mind when trading such patterns is that they are easy to spot after the fact. More exactly, only after the market forms the second top or bottom, or the third one, it becomes obvious that a reversal might be in place.
Also, one major drawdown of double and triple tops and bottoms is their resemblance with ascending and descending triangles. An ascending triangle is characterized by the market pressuring against horizontal resistance. Or, a descending triangle forms when the market pushes against strong horizontal support. At one point in time, the rejection or bounce in the price action might look like a double or triple top or bottom, when in fact the resistance, respectively the support, gives way.
If we compare a double top/bottom with a triple top/bottom, we see only few differences. In fact, the only differences is just another test of the horizontal area. When it comes to trading the patterns, the approach is similar.
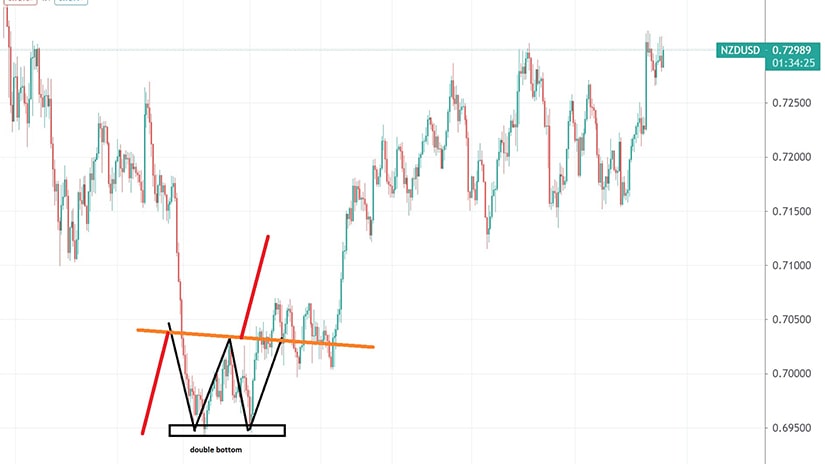
Double Bottom on the NZDUSD 4h Chart
 Our first example is from the recent NZDUSD 4h chart. The pair traded with a bid tone in April and May 2021, mostly on expectations of the Reserve Bank of New Zealand will signal an end to accommodative measures in the economy and on a general weak US dollar trend.
Toward the end of March and the beginning of April, the market tested the 0.6950 level twice. Because the FX market is extremely volatile, the trader needs to be flexible when interpreting the horizontal levels. As such, one should consider an area, rather than an exact level. Hence, the 0.6950 area acted as a major support, as the market bounced twice from it.
In doing so, it formed something that resembles the letter W. This is the first clue that a double bottom might be in place and the way to trade it is to draw a horizontal line at the highest point between the two lows.
That trendline acts as the pattern’s neckline and a break (and close) above it triggers the entry on the long side. The money management rules tell us that we must have a stop-loss and a take-profit level for each trade. In this case, the stop-loss should be set at the lowest point in the double bottom.
As for the take-profit, traders use a risk-reward ratio of 1:2 or even a bigger one. The pattern’s measured move is just the minimum distance that the market must travel in order to confirm the double bottom. Hence, more upside potential might be in the cards beyond the pattern’s measured move. On the chart below, the measured move is signaled with red, and the neckline with orange.
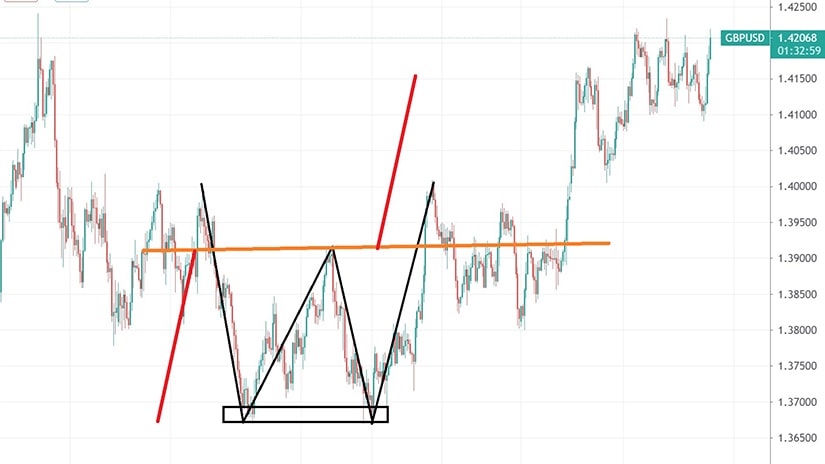
GBPUSD – Double Bottom With Neckline Retest
 Our second example comes from the GBPUSD pair. This is one of the most volatile currency pairs, and it formed a double bottom almost identical to the one presented earlier.
On its way to the downside, the price action has met strong support at the 1.37 area before bouncing back strongly. The neckline at the 1.3950 acted as strong support, as it was retested after the break, giving everyone a chance to get into the long side of the trade. The measured move was quickly reached, as the minimum distance that the market must travel.
At this point, it is worth mentioning that using a risk-reward ratio bigger than 1:2 is not the only way to trade the pattern. Another way is to book half the profits once the market reaches the measured move and, at the same time, to move the stop-loss order to break even to secure the rest of the position.
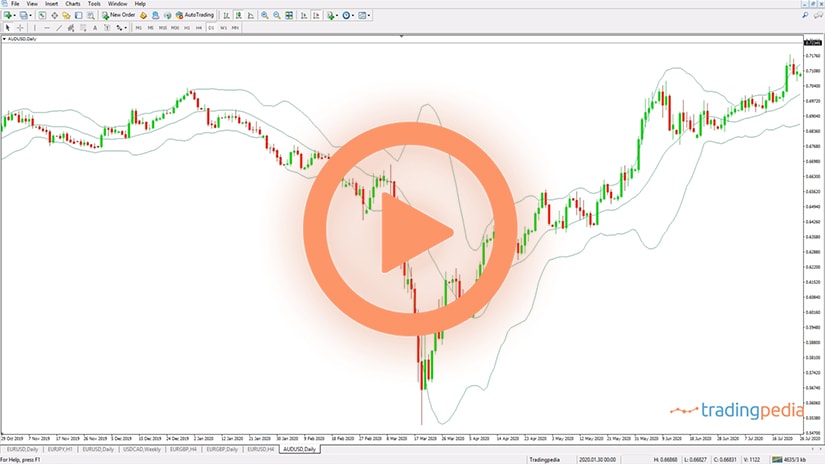
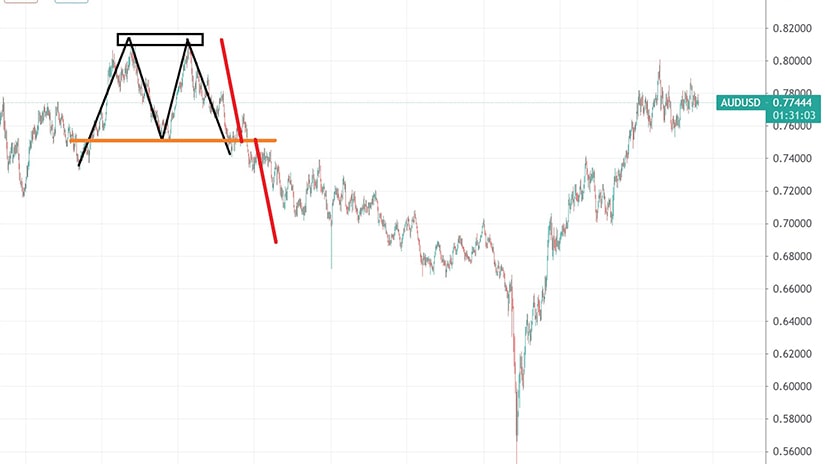
AUDUSD – Double Top at a Round Level
 Round levels play a critical role in market psychology. Typically, traders like setting their stop-loss or take-profit orders around psychological, round numbers. For example, one of the most important level in any market is parity – the point where the two currencies are equally strong. Beyond that point, one currency is weaker than the other, and parity attracts price action.
The 0.80 level acted as strong resistance to the AUDUSD bullish trend before the COVID-19 pandemic. However, the resistance held, and the measured move was quickly reached. This is the daily timeframe, and the pair consolidated for a while after breaking the neckline. Therefore, everyone that spotted the letter M got the chance to short the pair.
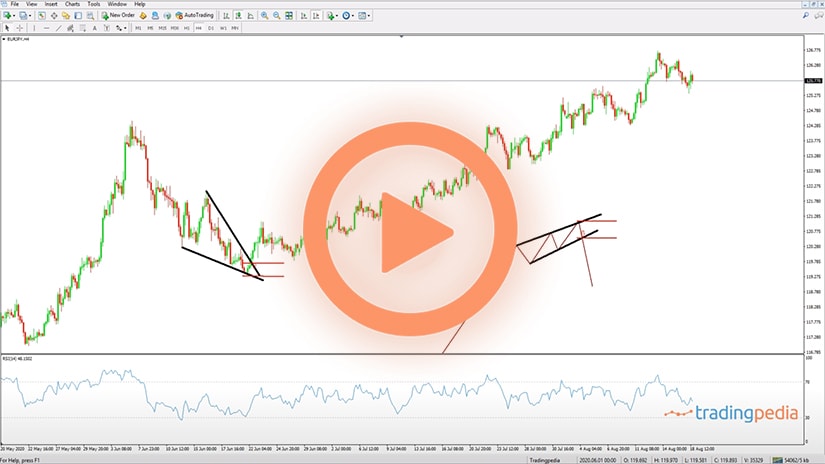
EURGBP – Triple Bottom on the Daily Chart
 Our final example comes from the EURGBP cross pair. This is one of the most important FX pairs for traders willing to speculate on the economic differences between the United Kingdom and the Euro area economies. It was particularly interesting to trade it before and after the Brexit vote when volatility increased significantly.
Speaking of the Brexit referendum, the market formed a triple bottom at the 0.70 level (another round number). The move higher after the breaking of the neckline was strong enough to ensure a risk-reward ratio bigger than 1:2. Also, the move following the triple bottom’s formation was so strong, that the market traveled more than two thousand pips.
This is an important point to mention. If and when a triple bottom or top holds, the upcoming price action is typically more powerful than the one that follows a double bottom or top. Also, if we are to compare the two patterns, the double tops and bottoms form more often than the triple ones.