
Hello there, this is tradingpedia.com and this video deals with how to use moving averages in Forex trading, but not necessarily in Forex trading only. Moving averages work on any financial markets. Moving averages are trend indicators. On the MetaTrader4 platform, you can find them under the Insert/Indicators/Trend – this is the moving average indicator.
Where To Find The Moving Averages
 Like any trend indicator, the moving average appears on the main chart and not on a separate window like an oscillator. This is very important because it gives you space for analysis.
There are multiple types of moving averages – under the MA method you can find them all. You can choose either a simple moving average, exponential, smoothed or linear weighted and actually there are many other types of moving averages that you can add via custom indicators on the MetaTrader4 or maybe they are being offered by other brokers on different trading platforms.
Most used are the Simple Moving Average, also called the SMA, and the Exponential Moving Average or the EMA. A quick thing to remember – the difference between the two is that EMA sits closer to the price and reduces the lag between the price and the moving average.
Features
 A moving average has 14 periods as the default setting, but you can alter it at any time. It refers to the number of candlesticks used to calculate the moving average. If we change the color and use an EMA with a period of 20, this black line that follows the market.
A MA with a period of 20 on the 4h chart on the NZDUSD, implies that the indicator, before plotting the last value, considers the previous twenty candlesticks. If we zoom in, we see the MA(20) here.
The beauty of a moving average is that it divides the screen in bullish and bearish price action. It makes it easier to identify trends, the general aspect of the market. The standard interpretation is that when the price breaks above the moving average, this is a bullish break, and the bullish market continues as the price has the ability to remain there. A bearish market begins when the market moves below the moving average. Obviously, we need to filter the information as trading is not easy.
How To Use Them
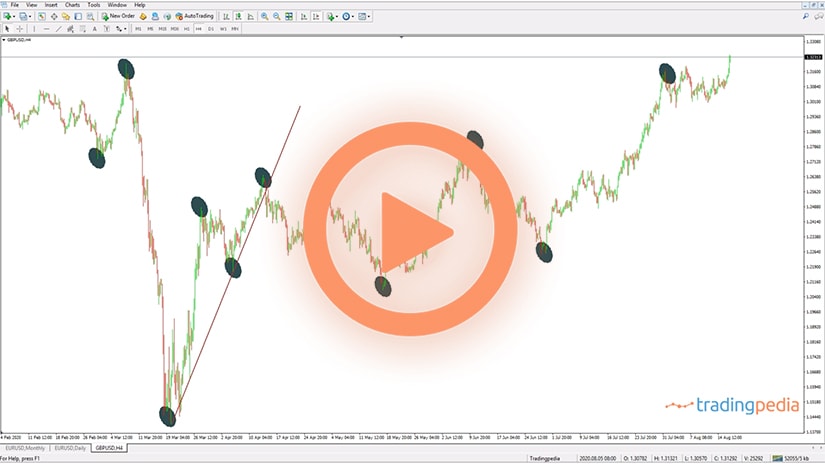
 One way to trade with moving averages is to use them as support and resistance levels, but that comes handier if we use more periods. Also called the mother of all moving averages, the MA(200) defines the bullish trend all the way from here, from May 2020 to August 200, in a strong, bullish move.
Moving averages, especially the big ones, offer dynamic and horizontal support and resistance. Once broken, support turns into resistance, and the other way around. The more the price has the ability to come to the moving average, the weaker the support or resistance becomes.
Another way to use moving averages is to use a faster moving average and a slower one. The MA(200) is the slowest one and it is not wise to add more periods because the line will become flatter and won’t follow the price anymore. If we add another moving average, let’s add the MA(50), with a different color, and apply it on the chart, we have two moving averages – one faster and one slower.
The intersection of these two moving averages is referred to as a golden or death cross. Golden cross forms when the fastest moving average moves above the slowest one. That is the place to go on the long side because the market changed, the bearishness seen here turned into bullishness. A golden cross is a signal to go on the long side and you should remain on the long side all the way until a death cross forms. So far there is no death cross on the NZDUSD, but you can adjust the entries and study the technique by going back in time and study historical prices.
For example, this is a death cross, and by the time the MA(50) moved below the MA(200), the market fell all the way to March. The trend started way earlier, in January with the death cross, and every time the price reached the MA(200) it offered an opportunity to add to the short side as it acted as resistance.
Remember that the more the price has the ability to reach the MA(200), the weaker the trend. This was one time; it made a new lower low and came again to the moving average. Shorting here for the second time still works, but with a question mark that the market might reverse, and a golden cross will form.
Related Videos
To sum up, trading with moving averages allows you to split the market into a bullish and bearish perspective. When the price remains above the moving average, that is a bullish market and below is a bearish market. When a faster moving average crosses above a slower one, that is a golden cross, and you will want to buy that market. The opposite is true after a death cross, you will want to sell that currency pair. Also, very important, the more the price tests the slower moving average, the weaker the trend becomes.
Considerations Before Using Moving Averages
 Moving averages are the simplest forms of technical indicators. Various types of moving averages exist, but they all serve the same purpose – they reflect bullish or bearish market conditions.
In time, the concept of a moving average evolved. Nowadays, it is not only about a Simple Moving Average (SMA), but computers made it possible to use variations of it.
We mentioned some of the different moving averages earlier in the article, such as the EMA. However, other exist, such as:
- DEMA – Double Exponential Moving Average
- FRAMA – Fractal Adaptive Moving Average
- HMA – Hull Moving Average
- KAMA – Kaufman Moving Average
- MAVP – Moving Average with Variable Period
- T3 – Triple Exponential Moving Average
- TRIMA – Triangular Moving Average
The names may sound fancy, but the principle remains the same. Only the formula used to calculate the current level of the moving average is different.
For example, the basics behind the SMA is that the indicator uses the closing prices of a certain number of candlesticks and averages them. That’s it. All other moving averages use a more sophisticated formula, but the interpretation of a moving average remains the same.
When using a moving average, traders want to:
- Spot bullish and bearish markets easily
- Identify dynamic support and resistance levels
- Spot trending conditions.
Pros and Cons of Moving Averages
 The main advantage of using a moving average is its simplicity. By simply splitting the chart into two parts, bullish and bearish, a moving average makes it easier to spot the bias in the markets.
On the flip side, moving averages may offer conflicting signals. To exemplify, think of the fact that many traders use a moving average so as to find support on dips and resistance on spikes. However, sometimes the market is too strong, and the moving average support or resistance does not hold.
Things to Avoid When Using Moving Averages
 To solve for the cons of using a moving average, traders should consider the following rules:
- The more often the market reaches the moving average, the weaker the support or resistance becomes
- Moving averages that consider a big number of candlesticks (i.e., slow moving averages) provide bigger support and resistance areas
- When applied on bigger timeframes (e.g., monthly, weekly charts), moving averages offer stronger support and resistance
Examples on the Recent USDJPY Chart
 The remainder of the article focuses on how to use moving averages. Below is the USDJPY daily chart, showing the recent price action.
The red line is the 50-period moving average, also known as the MA(50). Right from the start we may say that the market is bullish since January 2021. The rule of thumb when dealing with moving averages is that when the price action is above the moving average, the market is bullish. When below, the market is bearish.
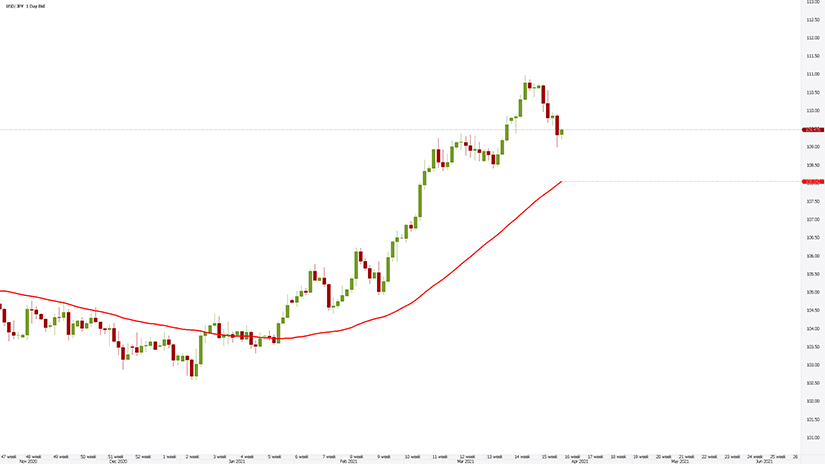
We can see from the chart above that the USDJPY did not yet test the MA(50). Effectively, it means that the trend remains strong, and market participants will likely look to buy the dip on the first attempt to break below the average.
Golden and Death Crosses
 The concepts of a golden and death cross belongs to the equity market. Long time ago, market participants noted that a bullish signal occurs when a fast moving average (MA(50)), crosses above a slow moving one (MA(200)).
They dubbed the pattern a “golden” cross, suggestive for more strength to come. Obviously, the opposite is a death cross, when the fast moving average moves below the slow one.
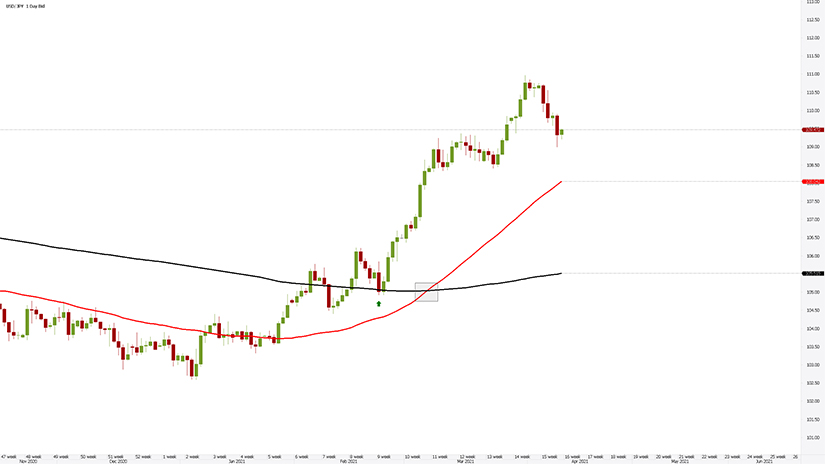
If we adjust the USDJPY chart and add the MA(200) (i.e., the black line), the golden cross is marked with a square. That is the moment when the market turned bullish, according to this strategy, quite some time after the price reached support on the MA(200).
Spotting Earlier Entries With Moving Averages
 To solve the problem of spotting a trend late after its starting point, some traders add an even faster moving average. The blue line below is the MA(20) – it considers only twenty daily candlesticks before plotting a value.
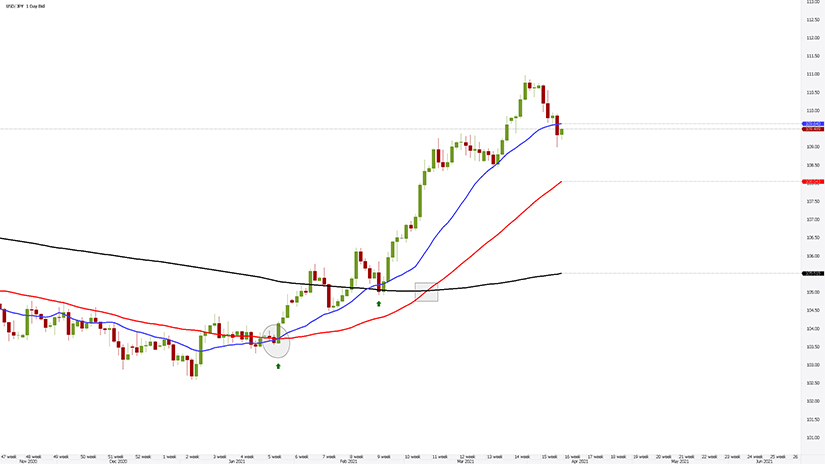
Because the period considered is way shorter than the ones used on the other moving averages, the MA(20), is closer to the actual price action. Using the same principle as explained earlier, when the MA(20) crossed above the MA(200), it is the first sign the market turns bullish.
Even if the signal is too aggressive for conservative traders, the USDJPY remained above the fast moving average. This is a bullish sign, but it also shows hesitation.
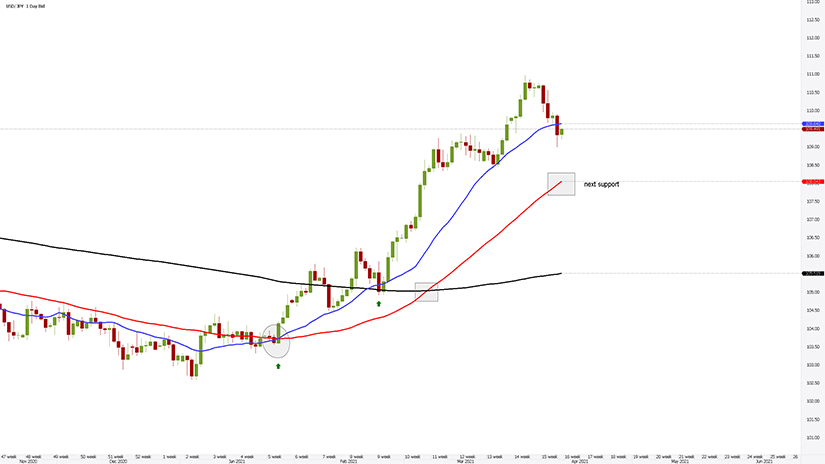
How come? Remember the things to consider – one of them is that if the price action is strong enough to test the moving average more than twice, the trend weakens.
Therefore, conservative traders avoid going long for the third time when the price reaches the MA(20). Instead, the focus now shifts to the next moving average, the MA(50). After all, it was not tested so far, and when the market does it, it will likely find support.
Perfect Order
 Finally, some traders add even more moving averages on a chart, with the intent of finding the so-called perfect order. The idea behind the perfect order setup is that the market is bullish when all the moving averages are aligned according to the number of periods considered.
On the chart above, the perfect order formed when the MA(50) (i.e., red line) crossed above the MA(200) (i.e., black line). At that point in time, all moving averages where aligned, showing a perfect order. For as long as they remain like this, the market is bullish.
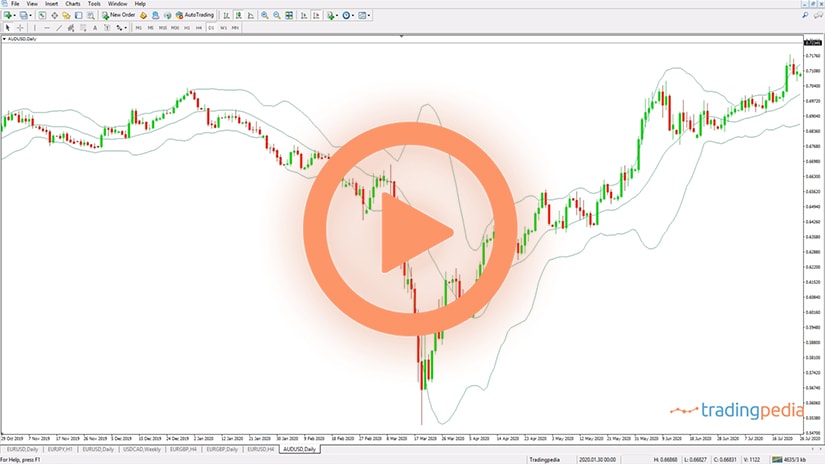
To sum up, moving averages are simple, but yet powerful technical indicators. They work well on their own, but also combined with other indicators.
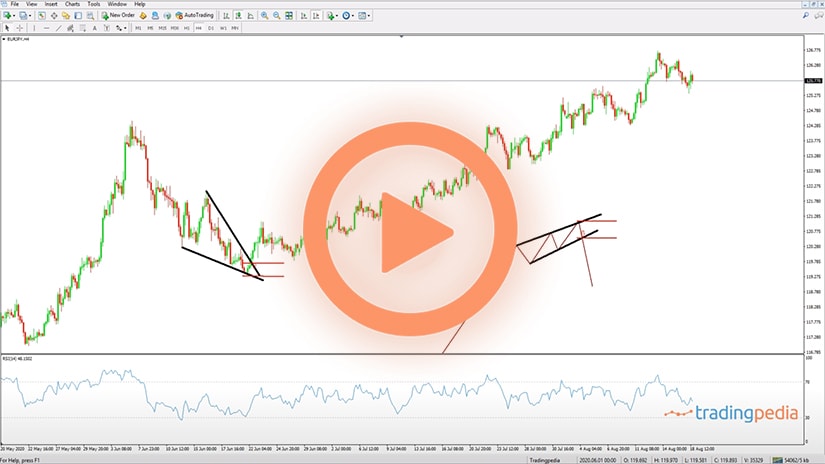
For example, the middle Bollinger Band is a moving average – either an SMA or an EMA. Moreover, some traders combine a trend indicator, like a moving average, with an oscillator, like the Relative Strength Index, and interpret them together.