
Hello there, this is tradingpedia.com and this video deals with the Bollinger Bands indicator – a technical analysis video. The Bollinger Bands video is one of the most famous indicators in the world, developed by John Bollinger, who is still well and alive and there is literally no trader in the world not knowing how to trade with it.
Where to Find It
 This is a trend indicator, to be found on the MetaTrader4 platform under Insert/Indicators/Trend and then Bollinger Bands here. Any trend indicator appears on the main chart window, in comparison with an oscillator that appears in a small window at the bottom of the chart.
The Bollinger Bands indicator can be edited in order to modify the periods considered. This one considers 20 periods before applying the indicator and if we click ok, it looks like this. It has three lines – the lower Bollinger Band (LBB), the middle Bollinger Band (MBB) and the upper Bollinger Band (UBB).
Over 90% of the time the price remains between these lines. Therefore the idea is to catch a rising or a falling trend, in order to participate the most to the price action and profit from it.
Strategies
 Various strategies exist to profit from this indicator. Usually the MBB is a moving average that sits close to the price, an exponential moving average, but also a simple one can be used.
What bulls like to see in a rising trend like to see the price action sitting in the upper part of the Bollinger Bands indicator and in a bearish trend, bears would like to see the price action in the lower part. So how to trade a bearish setup with this indicator? Simply going short on a break lower, have a stop loss at the UBB and trailing the stop. Trailing it means that the more the price falls, the UBB follows the price and you will be able to trail the stop.
Another way is to look at reversal patterns forming on the MBB. For example, this is a bearish cross, when the price moves below the MBB line. What trades do; they look at candlestick reversal patterns at the MBB line.
In this case, this small candlestick is a shooting star, a reversal pattern against the MBB, a nice place to go on the short side and set a stop loss at the UBB. Then look at 1:2 risk-reward ratio or bigger, depending on the aggressiveness of the trade.
Another thing to do is to interpret the breakouts above or below the extremes. If the bands are able to contain the price for more than 90% of the time, it is normal to interpret these breakouts as a sign of the trend to come. The market first broke below, a sign that the market is bearish, so trade reversal patterns on the MBB. Or, when the price broke here above the UBB, is a sign of a strong trend, so trade reversal patterns on the MBB. For instance, these two are called morning stars, and so on.
Last but not least, the Bollinger Bands indicator offers the possibility to use it as a volatility indicator in the sense that the ranges increase or decrease with the market activity. When the market moves quickly, the volatility increases, and the bands expand. When the market is slow, like here, you will see a very small distance between the UBB and LBB.
The key is to find out when a breakout will come. You can measure this distance, by using historical prices to find the narrowest possible distance between the bands, you measure it and use it as a filter moving forward.
Every time the indicator shrinks less than the measured length, it means that a breakout follows and when the volatility increases you wait for the price to go to the extremes and trade in that direction. For instance we see here that the volatility decreases below the threshold and then the market broke higher above the UBB. This is bullish, and for the next eighteen trading days the AUDUSD traded with a bullish tone. You may use that in your favor either using swing or scalping on lower timeframes until the conditions change.
Related Videos
To sum up, there are three ways to use the Bollinger Bands indicator. One is to stay on the upper half until the bullish trend reverses or to remain on the bearish half until the trend reversal. Another one is to add to a position by looking for reversal patterns on the MBB. Finally, use it as a volatility indicator as a great tool of finding breakouts as the price spends over 90% of the time between the UBB and LBB.
These are only some of the ways to use the indicator – others exist. But with these you should be on the right side of the market in the sense that following with a trade that has a stop-loss and a risk-reward ratio bigger than 1:2 is good money management coupled with an indicator’s use.
Bollinger Bands Trading Strategies – EURAUD Example
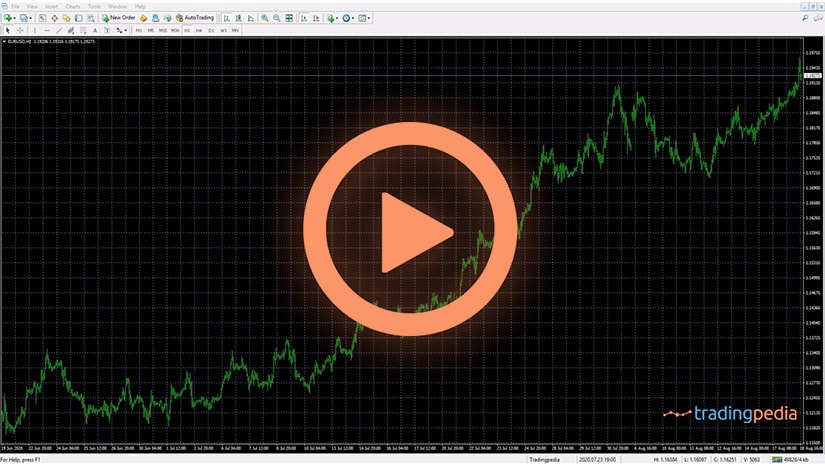
 There is no better way to understand a technical indicator and a strategy derived from its use than by giving examples. The following examples use the recent EURAUD 4h price action and are based on everything discussed so far in the article – and some more.
Various ways to trade with the Bollinger Bands indicator exist. The indicator has three distinct lines (i.e., Upper Bollinger Band, Middle Bollinger Band, Lower Bollinger Band), and they all have their role in interpreting the market.
However, the strategies described below use them separately in an attempt to catch the new trend as early as possible. Before anything, let’s have a look at the general characteristics of the Bollinger Bands indicator.
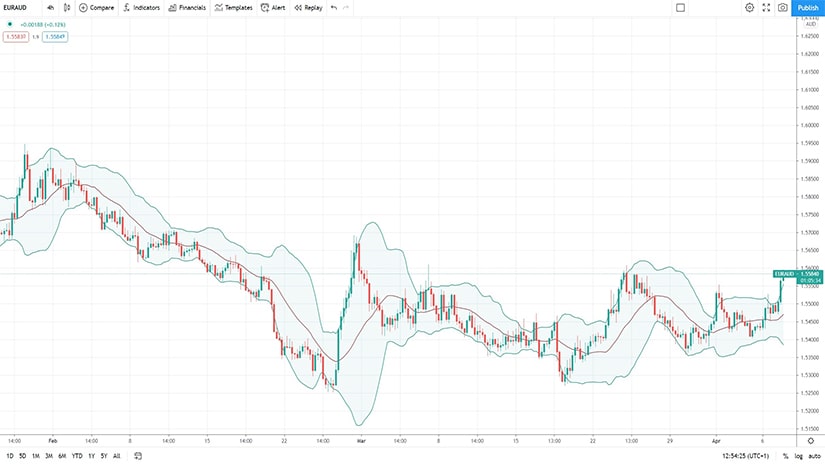
As mentioned earlier, the chart shows the recent price action on the EURAUD cross pair. The point here is to show that the Bollinger Bands indicator works on all timeframes and markets. Therefore, all strategies presented here can be applied successfully on other markets and timeframes.
Bullish and Bearish Trends with the Bollinger Bands Indicator
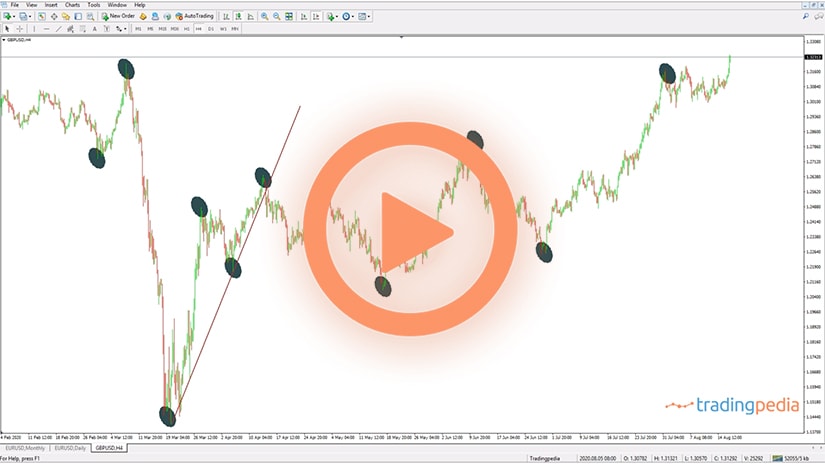
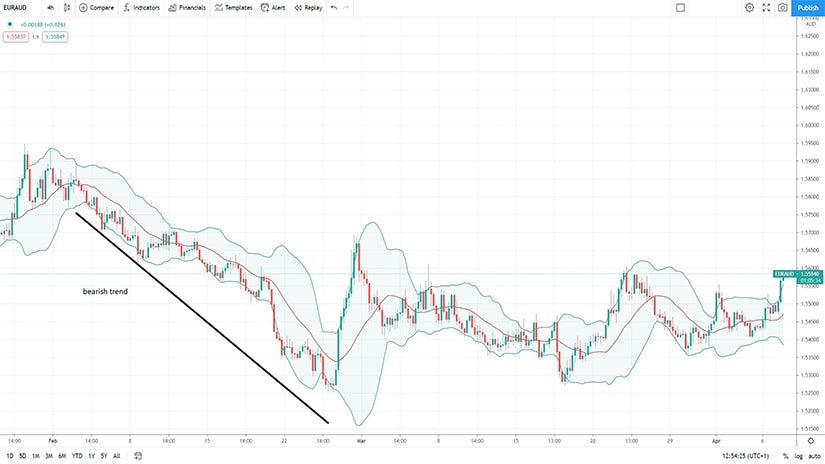
 The very basic way of trading with the Bollinger Bands indicator is to ride bullish and bearish trends. The rule says that when the price action is contained by the Middle Bollinger Band and the Lower Bollinger Band, the market is in a bearish trend.
In other words, all traders can do is sit and wait for the trend to unfold. Aggressive traders might want to add to the initial position every time the market reaches resistance given by the Middle Bollinger Band line.
Bullish and Bearish Breakouts with the Bollinger Bands Indicator
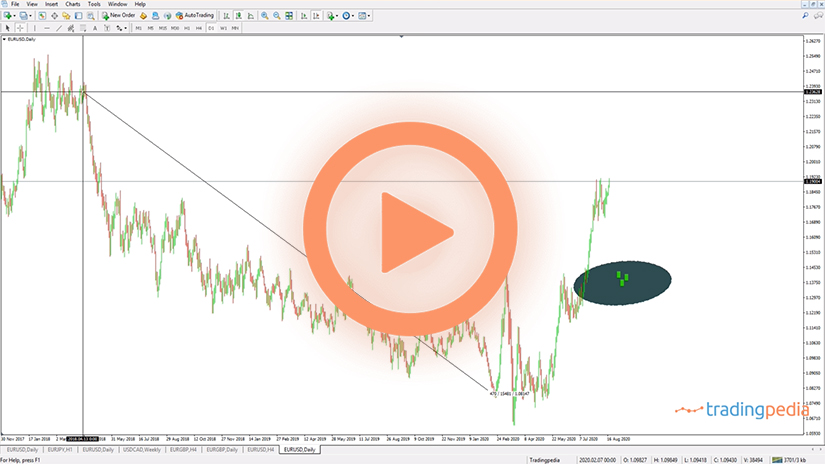
 Besides the trend-following strategy presented earlier, traders also use a breakout strategy with the Bollinger Bands indicator. The strategy is rather simple but very effective.
The key here is to wait for one candlestick that is strong enough that exceeds the distance between the Middle Bollinger Band and one of the other two bands. Let’s consider the candlestick shown in the first black rectangle on the chart above.
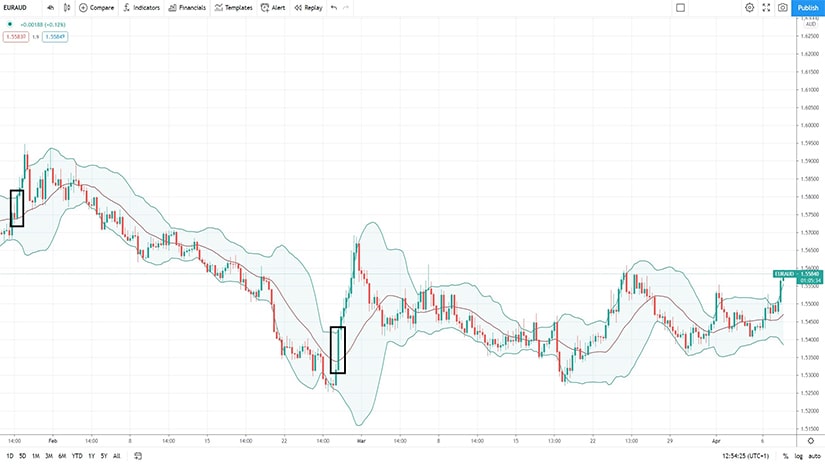
The bullish breakout is signaled by a candlestick that starts below the Middle Bollinger Band and closes above the Upper Bollinger Band. That’s a bullish breakout, and the market rose for the next twelve hours or so.
Moving forward, the second example shows an even more powerful breakout. This time the market advanced for more than twenty-four hours after the breakout, with no pullbacks.
Bollinger Bands as a Volatility Indicator
 Volatility is an important factor to consider when trading financial markets. Without volatility, traders would have a hard time speculating on a market’s movements.
But how to distinguish between periods with low volatility and high volatility? Is there a way to find out when volatility is about to increase? Luckily, the Bollinger Bands indicator provides a great insight into interpreting volatility.
The Upper and Lower Bollinger Bands signal changes in volatility. As such, when the distance between the two extreme bands widens, volatility increases. On the other hand, when the distance narrows, it signals decreasing volatility.
This is where the Bollinger Bands indicator becomes useful. The idea is to find out episodes with extremely low volatility and position accordingly. Why?
If the market’s activity declines so dramatically that the extreme bands narrow significantly, the indicator signals upcoming increase in volatility. Moreover, such episodes usually form ahead of important events for the market.
In the case of the EURAUD cross, such events might be the European Central Bank (ECB) decision and press conference, the Reserve Bank of Australia (RBA) decision, and so on. Or, a holiday, like the Easter holiday that ended recently, is enough for the market’s volatility to decline. However, the trader prepares for the upcoming breakout.
The way to trade it starts with identifying a historically small distance between the extreme bands. Next, project it on future prices and compare with what the market is doing.
If the two bands narrow more than the measurement, it means that a pick-up in volatility follows. Hence, traders buy or sell the breakout, basically following the price action.
Spotting Early Trends with the Bollinger Bands Indicator
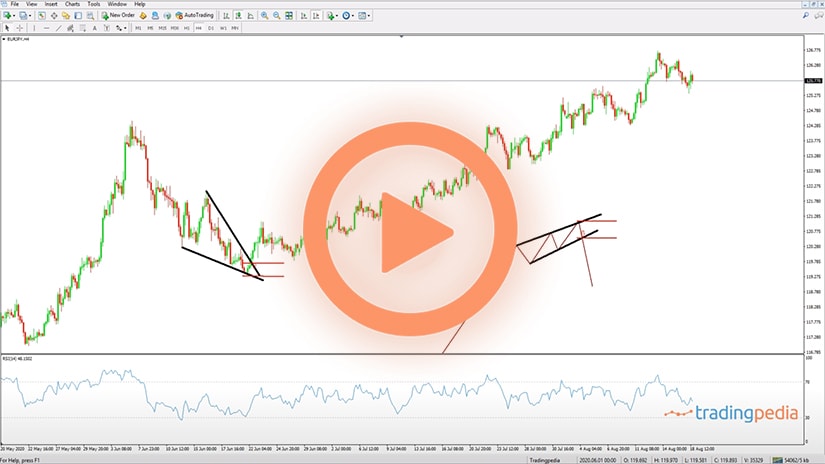
 The final strategy presented in this article focuses on spotting early trends with the Bollinger Bands indicator. The strategy focuses on the market’s ability to close below or above the Lower, respectively Upper Bollinger Bands.
If the bands are supposed to contain the price most of the time, such breakouts signal the start of unusual market price action. Therefore, the chances are that the market forms a new trend after such a pattern.
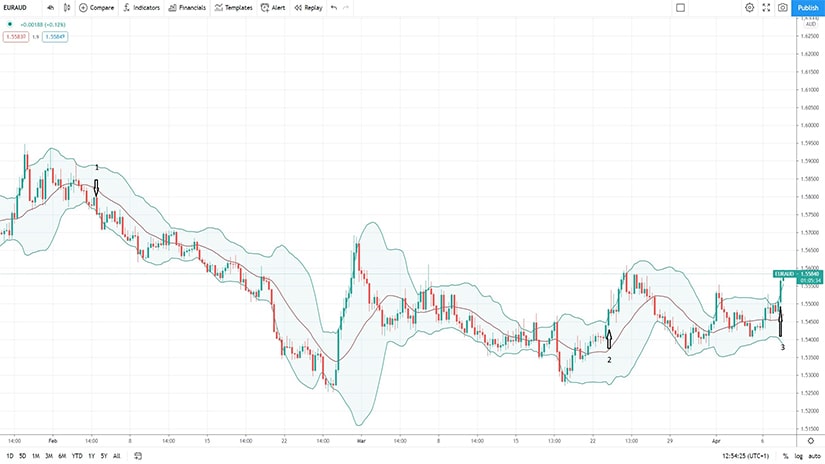
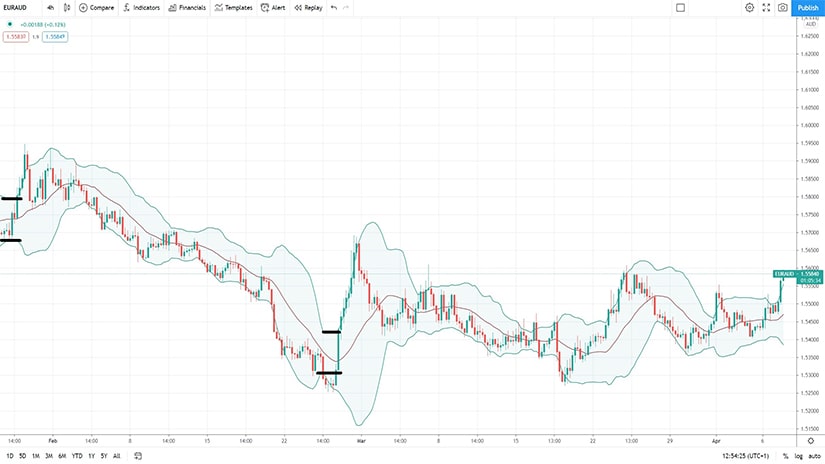
The chart above is the same EURAUD 4h timeframe. From left to right, three examples show how this strategy works. Remember – all you need is one candlestick to spot the entry on the short or long side.
The first example is a bearish one. We see the market declining and reaching the lower part of the indicator. Furthermore, one candlestick is bearish enough that it closes below the Lower Bollinger Band. That is a bearish signal, and traders usually go short with a stop-loss order at the highest point in the entry candlestick and target a minimum risk-reward ratio of 1:3.
Moving forward, the second example is a bullish one. The market is strong enough to close above the Upper Bollinger Band, signaling a bullish entry. However, the market quickly retraced after some small gains. It turned out it was a false breakout.
The next signal points in the same direction as one bullish candlestick closes above the Upper Bollinger Band again. If the market will continue its bullish run, it remains to be seen.
All in all, the Bollinger Bands indicator is used in various ways by traders around the world. Some traders even interpret divergences between the Bollinger Bands and some oscillators.
The point here is that using multiple strategies with the same indicator and on the same market makes it impossible to miss future trends. This is why the Bollinger Bands indicator is so valued by traders from all over the world.