
Hello there, this is tradingpedia.com and this video continues the “volume” series if you want. We discuss here the Volume Spread Analysis (VSA), as the Volumes indicator shows only the activity on a certain broker.
Overview
Nevertheless, it does offer an idea about the overall market direction. The VSA is a trading theory that works on both the FX and the stock market and is based on four different phases: accumulation, mark-up, distribution, and mark-down.
These four phases represent a cycle, and they sit at the very core of the VSA theory. They imply that the market is always at one of these phases.
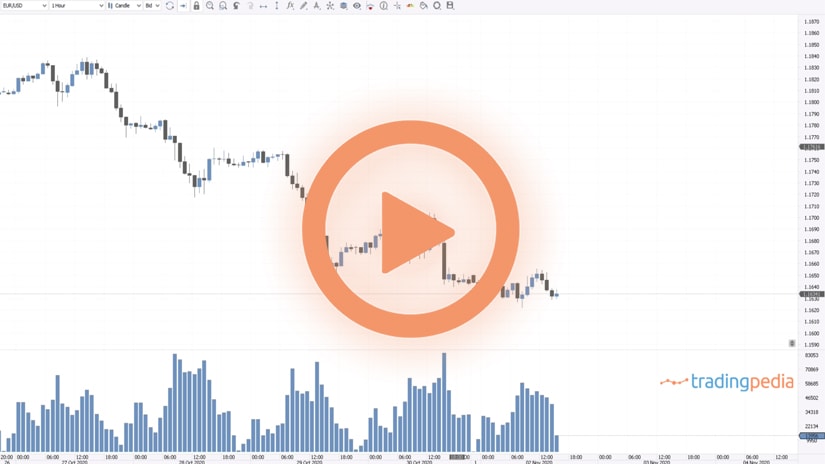
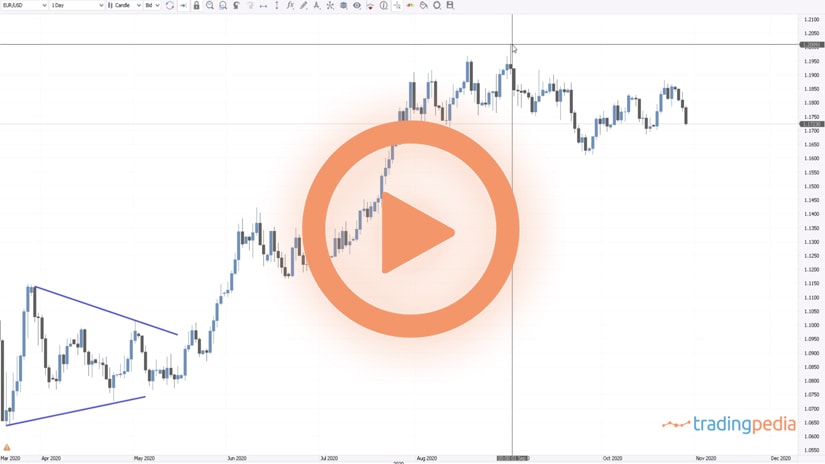
Even now, at the current level, 1.1628, the EURUSD must be at a certain point during this sequence. The idea is that traders use the information given by the Volumes indicator to find out which one of the phases the market is in and to align the interests to the direction of the smart money or where smart money goes. By smart money, traders refer to institutional investors and big money managers that have huge AUM.
Accumulation Phase
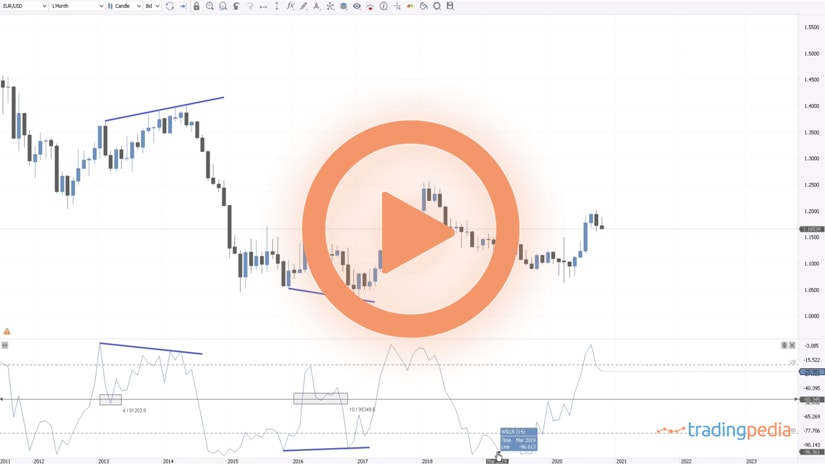
It all starts with the accumulation phase. The EURUSD accumulated since March 2020 with the coronavirus crisis and the accumulation phase is mostly a horizontal area with small volume, as strong hands are buying, and weak hands are selling. Therefore, strong hands or smart money accumulates constantly, and weak hands are selling.
Next, the market starts to move higher and we see a bit of increase in the volume. This is the start of the mark-up period or phase. During this phase, there is still low volume – equal or lower than what we have seen during the accumulation phase.
The market travels during this phase, but on low volume – this is a crucial part of the VSA strategy. Also during this phase strong hands will start selling. Those that bought 1.0870 book profits at 1.14 for about 700 pips, but weak hands start to buy. Also, this part can be interpreted as new accumulation as well, judging by the low volume.
Distribution Phase
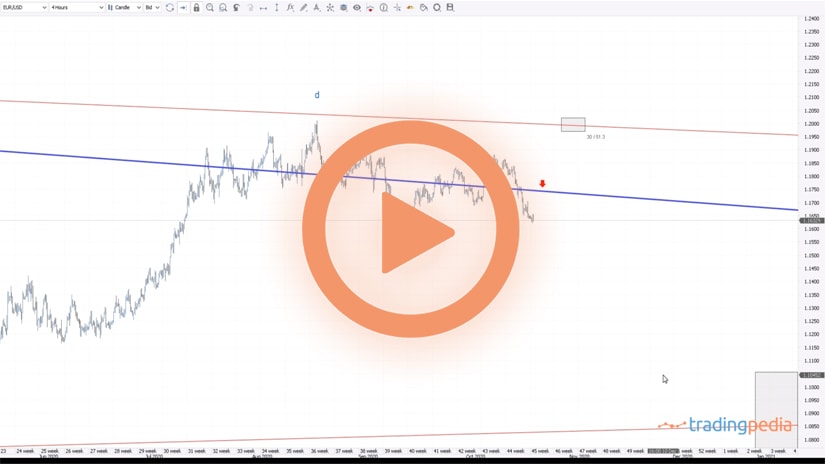
Then, the mark-up continues until at one point in time when we see a change in behavior given by an unusual spike higher in volume. This is where the distribution phase begins.
How do we know where it started? It started with the rise in the volume, in August 2020 and it continued all the way until November now. How do we know that? We know that because this is a high volume and then declines without the market going anywhere.
We may say, at this point in time, that distribution is about to end, and the market will start the mark-down phase. How do we know that this is the start of the mark-down phase and not another accumulation followed by another break higher?
Well, we do not know that at this point, to be honest. What we need to see is the volume to decline to similar levels as the previous accumulation and if the market breaks higher with small volume, we will interpret this as accumulation and another mark-up phase to start.
But if the market keeps these levels and the volume declines, then retail traders will begin aligning their interests with smart money, etc. During the distribution phase we see that there is a lot of changing behavior.
Related Videos
Conclusion
To sum up, the volume spread analysis works on the FX market as well and is made up of four phases: accumulation, mark-up, distribution, and mark-down. The VSA works very well when studying the stock market but it also pretty well on the FX market too, as this example illustrates.
Have a great day – bye, bye.