
Hello there, this is tradingpedia.com and this video deals with the Volumes indicator when trading the currency market. We will cover traders’ expectations and why this indicator is not suitable for trading FX.
Overview
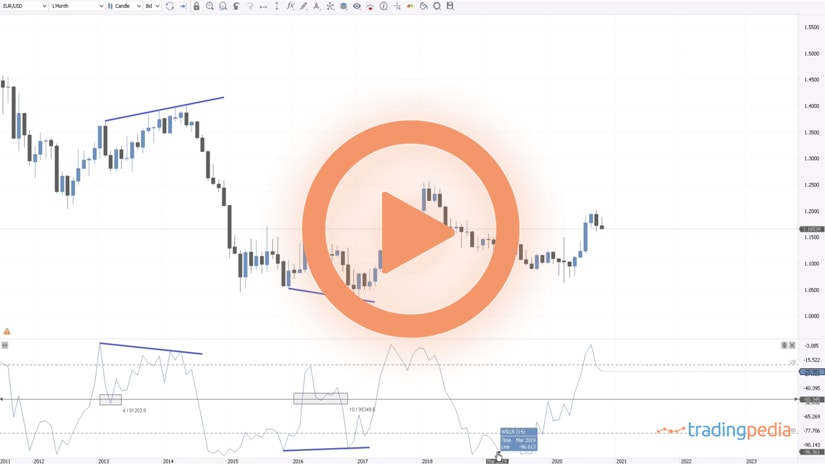
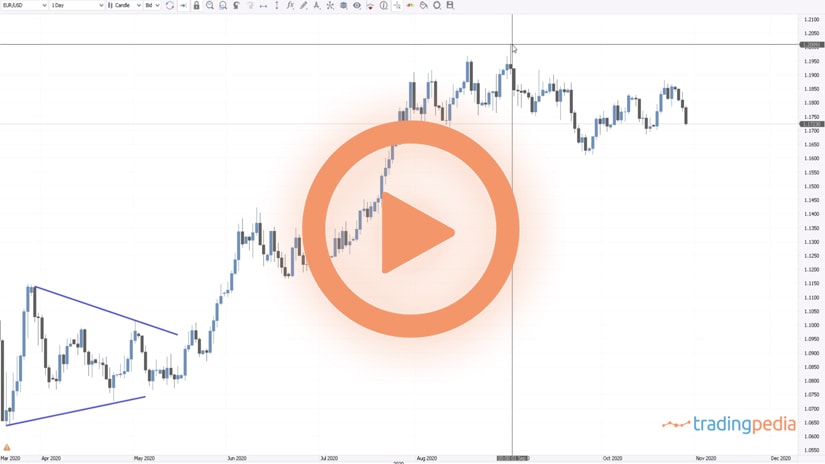
This is the daily EURUSD chart and the indicator at the bottom is the Volumes indicator. It shows the trading volume on any currency pair on any currency pair on that period. This being the daily chart, we see that the trading week is divided into five trading days and one small candlestick that represents the Sunday candlestick. Not all brokers show it, but this one shows the trading activity and the volume traded at that time.
If we move to the hourly chart on the EURUSD we see the volume during the last hours. For instance, during the last hour, the volume on the EURUSD pair was 40,652, this one here 46,585, and so on – a declining volume on a market that did not go anywhere.
Volume Trading Strategies
Why do traders want to know the volume of a security? Volume trading strategies belong to the stock market because any company has a limited number of common shares issued to the public. Then, when you interpret the volume of a specific market security like a company that is listed on the stock market, you have an idea about the interest on the long or short side of certain parties.
For instance, if you know that the outstanding number of shares of a company is 50 million and then during the course of a trading week 20 million change hands and the market moves, you can align your interest with the market’s path of least resistance.
On the FX market there is a catch when using the Volumes indicator. The indicator is not of a much use with the standard approach because the volume of the entire FX market is unknown. This is not the entire volume on the EURUSD chart on today, November 2nd. Instead, it is only the volume displayed by this broker. More precisely, it is only the volume traded at this broker. But how many brokers exist in the world? How many transactions on the EURUSD are unaccounted for on the regular retail brokers?
Therefore, this is peanuts when compared to the overall FX volume in the world. Nevertheless, it gives us an idea about what the market does and a small-size sample regarding the market activity.
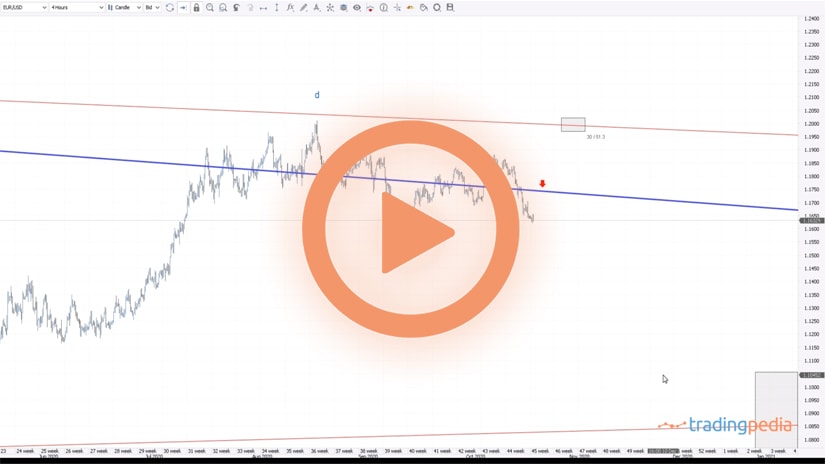
What is the secret behind the volume indicator? The higher the volume, the more traders will tend to emphasize that market move. For instance, we see on the EURUSD that from the 31st of July until November 2nd the market did not move much. Basically, it stays more or less at the same levels.
We see that during this horizontal price action that the volume increased when compared to the previous period when the market moved higher. People would like to find out candlesticks that show trading activity bigger than normal. For example we see that the highest volume on the EURUSD during these three months was on September 17th and October 2nd, around 1.4 million. We may say that his was, in a way, a double top on the volume.
However, if we check the candlesticks on the actual market, they are quite small and irrelevant on the overall price action. The explanation comes from the fact that the volume indicator here shows only the market activity on this broker.
Moreover, it is not the same volume data that we will see from one broker to another. For instance, one broker may run a promotion, to stimulate traders to be more active, to reward trading activity by a certain amount for a specific period. Therefore, because the trading activity increases, the volume increases too at that broker, but another broker will not reflect this volume.
Related Videos
Conclusion
All in all, when you think of the volume indicator in the FX market, it is not working in the same way on the FX and in the stock market. The difference is that in the stock market the number of shares is limited, and on the FX conditions are different.
The next video deals with a volume strategy, the Volume Spread Analysis, and you will see how traders use the Volumes indicator in the FX market – not in a traditional way.
For this video, keep in mind that the Volumes indicator shows only the transactions at a specific broker. It has nothing to do with the overall volume on the FX market.
Bye, bye.