
Hello there, this is tradingpedia.com and this video deals with an oscillator, called Williams Percent Range, presented here at the bottom of this chart. You can find it on all trading platforms and, before starting it is important to specific that this indicator does not repaint. More precisely, the values that the oscillator plots here do not change once a candlestick closes.
Overview
This is an oscillator that travels only in negative territory, from 0 to -100. Like most oscillators, it has an overbought and an oversold level, with -80 acting as oversold and -20 as overbought. The idea is that one of the approaches to trade with this oscillator is to buy oversold and sell overbought.
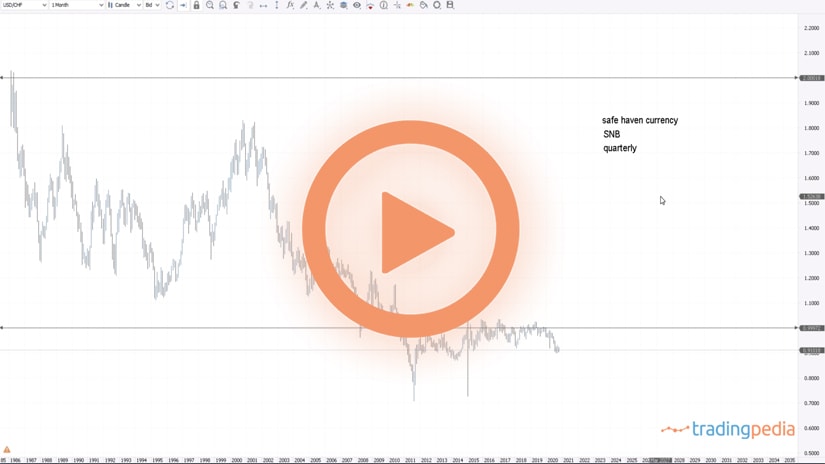
I want to start with the monthly chart to give you an idea about how to use this oscillator and then to go on the lower timeframes. One can use the Williams Percentage Range on all the timeframes. For scalping, one can use the five-minute or the hourly chart, and for swing trading or investing, the bigger timeframes.
The risk of trading overbought, and oversold areas is that the market will end up moving more aggressively into oversold and overbought areas, and therefore, this strategy works best when ranges are in place. But, how to identify ranges?
Divergences
In order to avoid being trapped in such strategy, the ideal way to trade with this oscillator is to use divergences. A divergence appears when the market forms two higher highs, but the oscillator fails to confirm the second high. This way, the oscillator diverges from the price.
But there are divergences and divergences. The ideal one forms into overbought and oversold territories. In the case of this oscillator, we should use divergences only when the oscillator retraces half of the range between overbought and oversold when the price action is between the two highs or the two lows.
For instance, this might look like a proper divergence, but the oscillator did not travel beyond the -50 level. Therefore, in order to interpret a divergence, wee need the oscillator to go into overbought. Next, the market retraces, and the oscillator closes below 50. Following that, the market makes a new higher high, but the oscillator fails to confirm it. This is a bearish divergence and the validity for the divergence was given by this move below the 50. This is a price that rises, and this is the oscillator that did not confirm it.
Moving forward, we see the price here forming a low and then a lower low, so this would be appropriate for a bullish divergence in this case. Also, the oscillator does not confirm the second lower low. Is this a valid divergence? It is, because the Williams Percent Range retraced beyond the -50 level and did not reach overbought.
Is this one a bearish divergence? We that the price formed two higher highs and the oscillator did not confirm the second high. While the price declined after it, this is not a bearish divergence because we do not have a decline of the oscillator beyond the -50 level. This is how we filter between signals with this oscillator.
This strategy is valid or can be used on all the timeframes. Let’s go on the daily chart, for instance. Is this a valid divergence? We see that the oscillator fails to confirm the second higher high, but the oscillator, while moving beyond the -50 level, it exceeds it and closes into the oversold area. This is not a divergence, despite that the price did move lower. Therefore, we should ignore this one, as these types of divergences often result in terrible trades.
Is this a bearish divergence? The market formed two higher highs, the oscillator did not confirm the second high and, at the same time, the oscillator moved beyond -50 and did not reach the oversold level. Therefore, this is a bearish divergence, and we should go short here. This would be a valid short signal.
The same happened here, right at the top, because the oscillator formed this divergence here and exceeded the -50 without reached oversold. Therefore, another place to go short is right here, at the close of this candlestick.
Related Videos
Conclusion
This is the daily chart, and previously we looked at the monthly chart. This is only one currency pair out of the entire FX dashboard and one can use any currency pair and any timeframe to trade divergences with the Williams Percent range, as this is the best way to make the most out of this wonderful oscillator.
Have a great day – bye, bye.