
Hello there, this is tradingpedia.com and this video deals with non-limiting triangles, as we expand the notion of triangles part of the Elliott Waves Theory. In the previous video we looked at limiting triangles and said that they form only as the fourth wave of an impulsive wave or the b-wave of a zigzag. This characteristic makes limiting triangles really rare patterns – they do not form that often.
Non-Limiting Triangles – Overview
On the other hand, non-limiting triangles form extremely often. Therefore, whenever you hear a double combination or a complex correction that ends with a triangle, think of a non-limiting triangle. A triangle part of a complex correction is always non-limiting. In a non-limiting triangle the market always pierces the a-c trendline with the e-wave. Therefore, we will have a-b-c-d-e and the e-wave is long enough to pierce the a-c trendline. If this simple rule is not respected, then that is not a non-limiting triangle.
Complex Corrections
Non-limiting triangles form at the end of complex corrections. Whenever you see a non-limiting triangle at the end of a bearish trend, it means that the market ended a complex correction. In other words, a triangle at the end of a trend cannot be limiting, but it will be non-limiting.
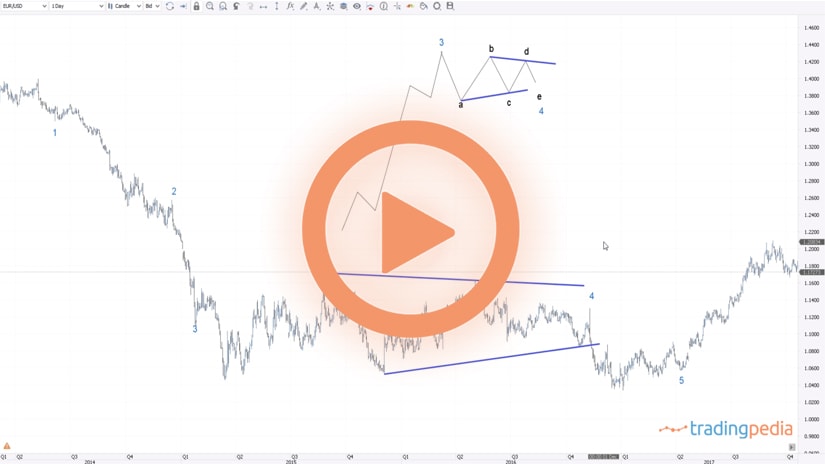
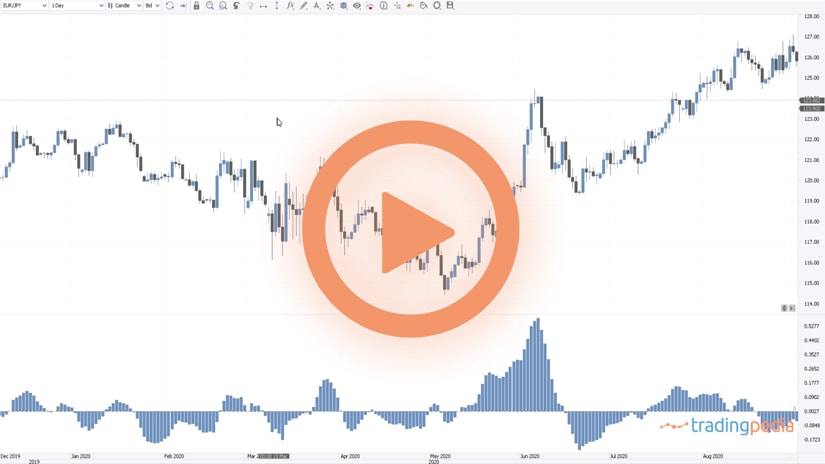
For instance, this is the EURUSD and we see that in 2020 formed a triangle at the end of a bearish trend. This triangle must be non-limiting. It means that the price action that follows has no limit. Another difference between limiting and non-limiting triangles is that the apex of a limiting triangle is much stronger in providing support and resistance than the apex of a non-limiting triangle.
Non-limiting triangles do not appear as simple corrections – they are always part of complex corrections with one exception. That is, when the non-limiting triangle is part of a terminal impulsive wave.
Therefore, this triangle here was part of this complex correction, and our job is to determine what kind of complex correction the market formed here and what are the implications for the move to follow.
The EURUSD bounced from that moment on and, right at the top it formed three higher highs. Together with the retracements, the five segments suggest a triangle.
Can it be that this is a-b-c-d-e? If the market respects the rule of breaking the b-d trendline, that is a non-limiting triangle, at the end of complex corrections. Therefore, this must be a complex correction.
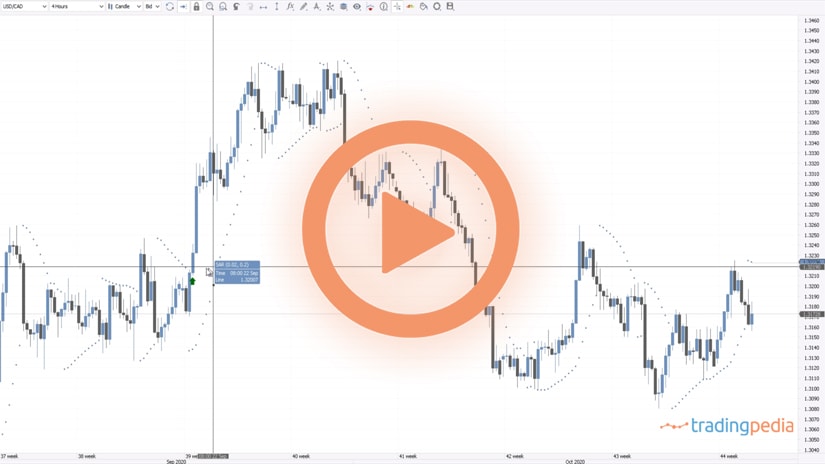
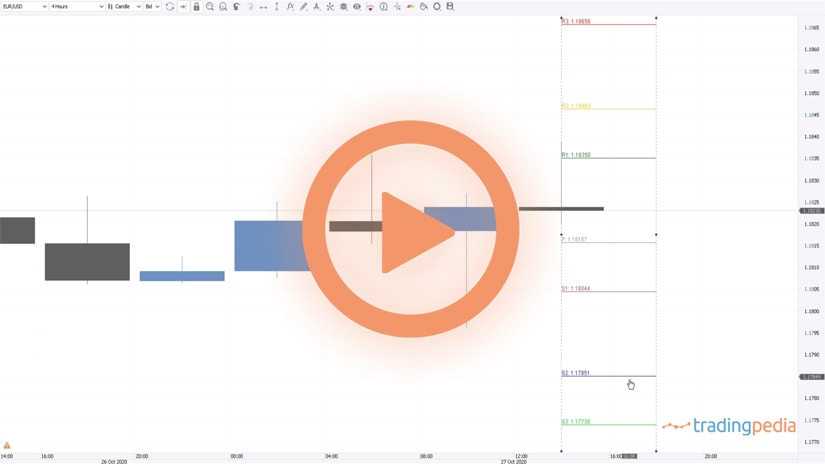
Your next task would be to label this move to the upside from the end of this triangle, to count the waves until the end of this one. Even at the current levels the EURUSD formed a triangle visible on the lower timeframes. Let’s go on the hourly chart. What did the market form recently? We see three attempts at the highs, and the market formed a triangle. However, if we draw the b-d trendline and the a-c one, we see that the e-wave did not pierce the a-c trendline – a mandatory condition in a non-limiting triangle. Therefore, this cannot be a non-limiting triangle because the piercing does not exist.
Can it be a limiting triangle? No. Limiting triangles appear only as the b-wave of a zigzag or the fourth wave of an impulsive move. But if the triangle ended here, neither of the two scenarios are possible. Therefore, the market looks like a triangle, but it is not one. How about this one here? Whenever you see this pattern, you should think of a triangle.
Related Videos
Conclusion
Triangles are common patterns forming on all timeframes, on all currency pairs and all markets. Non-limiting triangles must pierce the a-c trendline before reversing sharply. Sometimes the e-wave is a non-limiting triangle on its own.
Thank you for being here and have a great day – bye, bye.