
Hello there, this is tradingpedia.com and this video deals with two different concepts – top/down and bottom/analysis. They belong to two different worlds, but many traders use them both on the currency market often and we will cover here the advantages and disadvantages of these systems.
Overview
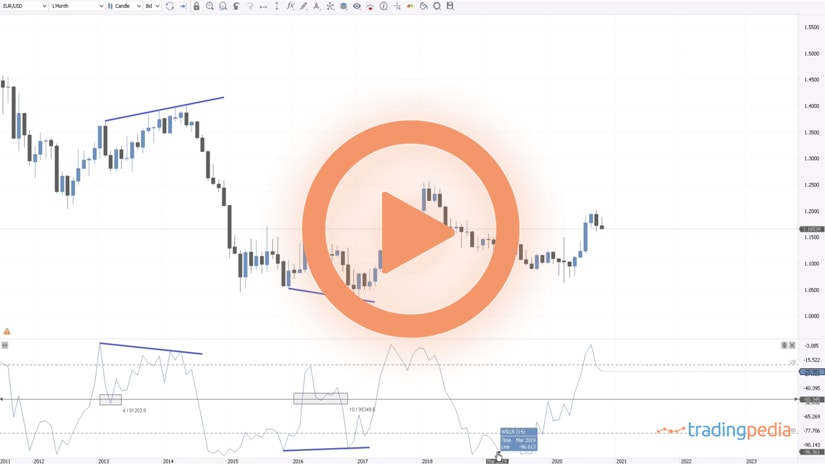
This is the EURUSD monthly chart that trades now 1.1630 as we start the US elections week. Any top/dop down analysis starts with the bigger timeframes, following a step by step approach, as the trader starts from the bigger timeframes, analyzes the market and then gradually moves on the lower timeframes and continues the analysis from where it ended, until the trader reaches the timeframe where a trade can be placed. No retail trader will act on the monthly chart.
Therefore, a top/down analysis always starts from the bigger timeframes to the lower ones. On the contrary, a bottom up analysis always starts from the lower timeframes to the bigger ones.
TopDown Analysis
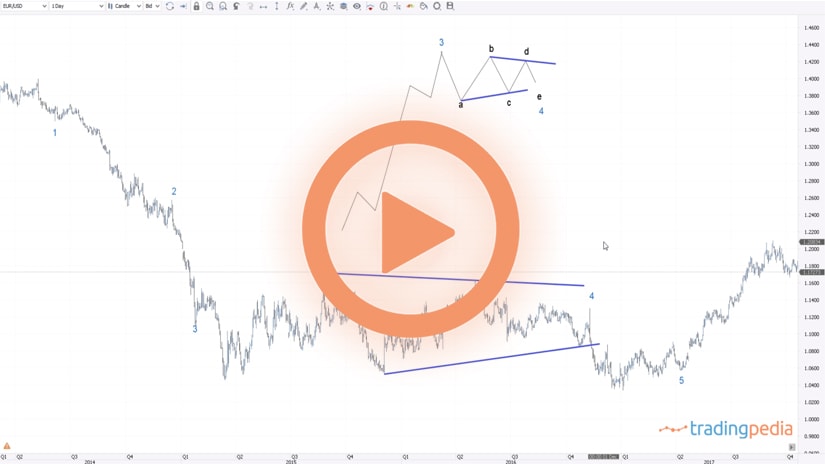
Let’s focus on the top/down analysis, as this is the EURUSD on the monthly chart. In such an analysis, it means that we will look at the market on the bigger timeframes trying to find important clues about future price action. For instance, if we draw a trendline connecting these two points, we see that the market tested it many times and the price remains in a bearish trend. Every time the market comes to the trendline, the trendline represents a resistance level, in this case. The bigger the timeframe, the bigger the support or resistance level. This is why it is important to do your homework on the bigger timeframes, to start the top/down analysis there and then to follow up on the lower ones.
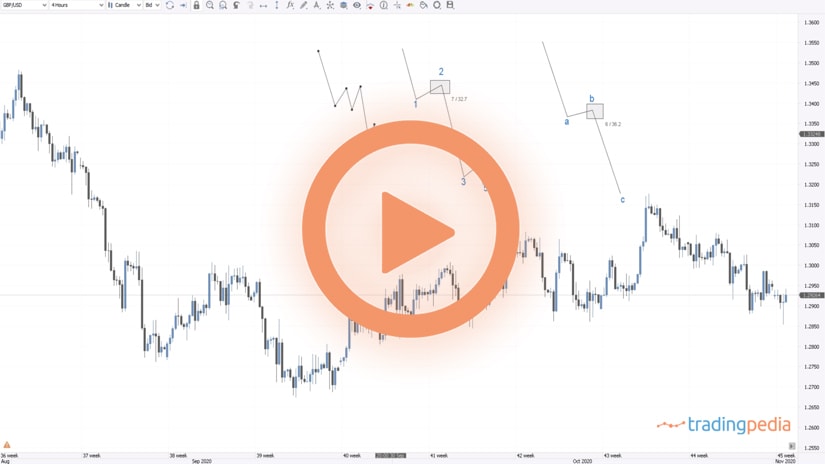
Let’s say that we also label this one using the Elliott Waves Theory. As such, this would be the a-wave, then the market forms a b-wave, and the c-wave follows. Next, this is not the d-wave in a triangle because of the rules of the b-d trendline. It means that this is the x-wave of a complex correction and then the market forms probably a contracting triangle in order to end a double combination.
In this arrangement (a-b-c as a flat and the x-wave that does not retrace more than 61.8% of the first a-b-c), the market forms a double combination. To trade it, we cannot take a position here, but we can go on the lower timeframes and use the principles of a top/down analysis.
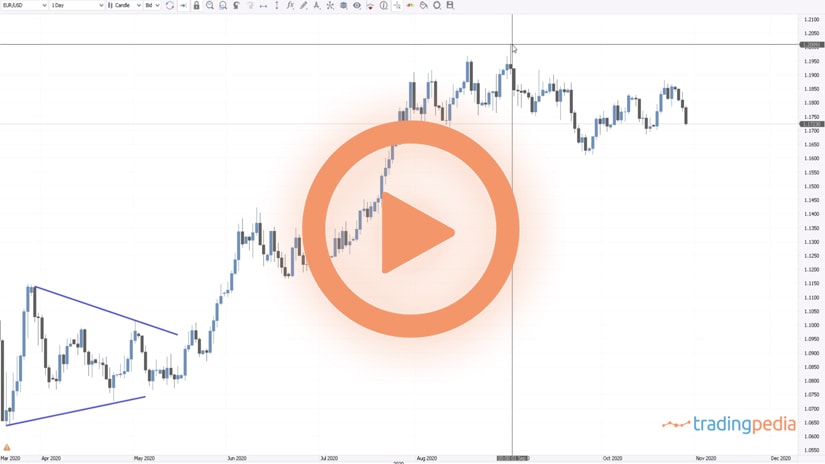
On the daily chart we take it one step further. We want to illustrate the triangle here, because when the b-d trendline of the triangle of a lower degree is broken, the triangle ends. The market moved back below major resistance on the monthly chart, and then formed a possible contracting triangle on the daily chart.
If we believe that this is a contracting triangle at the end of a double combination, then this is a non-limiting triangle. Such a triangle should go and pierce the a-c trendline. Therefore, there is still plenty of room for the EURUSD to move lower. The invalidation would be if the market breaks the b-d trendline.
Assuming we have a trade suggesting the market should go to 1.0850, we should wait a pullback against important resistance on the monthly chart, place a stop-loss at the b-d trendline as that would invalidate the trade, and for the take profit this would be the level.
This is how to use a top/down analysis. Obviously, I used here a simplified approach. Normally, a top/down analysis starts with the yearly chart and all the historical data on a currency pair, and so on. And then, it continues with Fibonacci support and resistance, Elliott Waves patterns, divergences, etc.
Related Videos
BottomUp Analysis
How about the bottom up analysis? The concept of this analysis doesn’t quite bode well on the lower timeframes due to the “noise” there. Therefore, you might want to start from slightly higher timeframes.
But this concept bodes very well with fundamental analysis of a currency pair, of the two economies that represent the currencies that belong to that currency pair. We start with microeconomics and continue to macroeconomics. In the first case, we look at the impact on the local economy from the classic, regular economic data, like the PMIs, GDP, etc.
Next, the macro perspective refers to what those changes imply from a global perspective. For instance, what will the lockdowns in the European Union will bring to the EURAUD pair, for example?
A bottom up analysis is also used when interpreting fundamentals on companies on the stock market. Thank you for being here and have a great day – bye, bye.