Hello there, this is tradingpedia.com and this video deals with cycle indicators. If you are not familiar with cycle indicators, then you are about to. It is not only about one indicator as the name of this video suggests, but about two indicators.
If you try to find out the rest of the indicators part of the Hilbert Transform you can easily find them on the Internet and upload them on the MetaTrader platform.
Hilbert Transform Trend vs. Cycle Indicator
The name of this video – trend vs. cycle – comes from this indicator here, called Hilbert Transform Trend vs. Cycle. The one below is called the SINE Wave. Used together, they help us to spot trending conditions on the market and act accordingly.
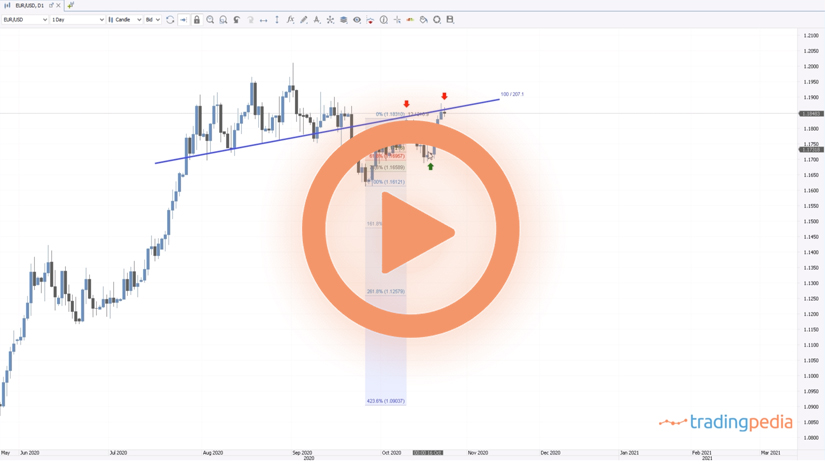
This is the EURUSD on the daily chart and everything that we will discuss here on the EURUSD is valid on other markets as well. These are not the only indicators into the cycle indicators category, but the combination of the two makes it easier to interpret the market moves.
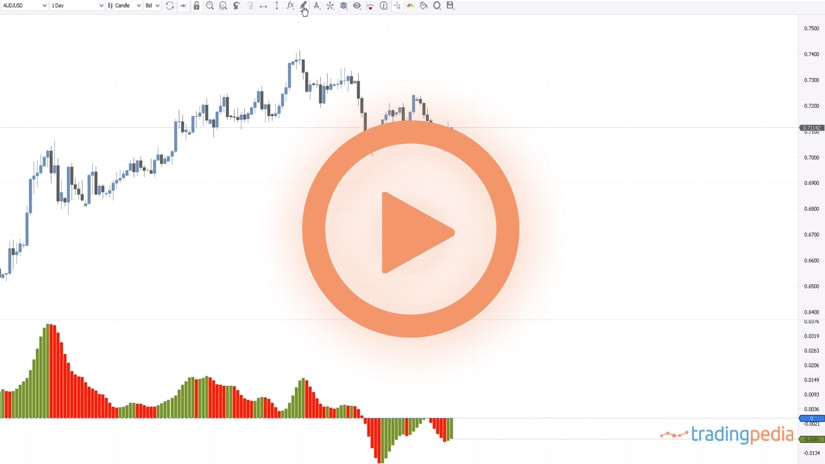
Let’s look a bit at what these indicators show. This trend vs. cycle is a binary indicator in the sense that it will show either a value of 1 or 0. The interpretation is very simple – when the indicator switches from 0 to 1 it means that a new trend started, it entered a trending phase. This is very important when trading financial markets because the price spends most of the time in consolidation. But for a trader, it is important to know when the market is in a range or when it is trending.
For instance, if the market spends time in a range, one may use oscillators like the RSI, etc., to find out overbought or oversold levels. However, that works only in ranges and not in trending conditions. Trading overbought and oversold will lead to tremendous errors on the long-term positions if trending conditions are in place.
Therefore, this indicator helps us understand the difference between the trending and range conditions and then we can easily apply the appropriate strategy. As such, when Hilbert Transforms switches to 1, it means that a possible trend starts. We must use this information together with the one given by the SINE Wave.
The SINE Wave Indicator
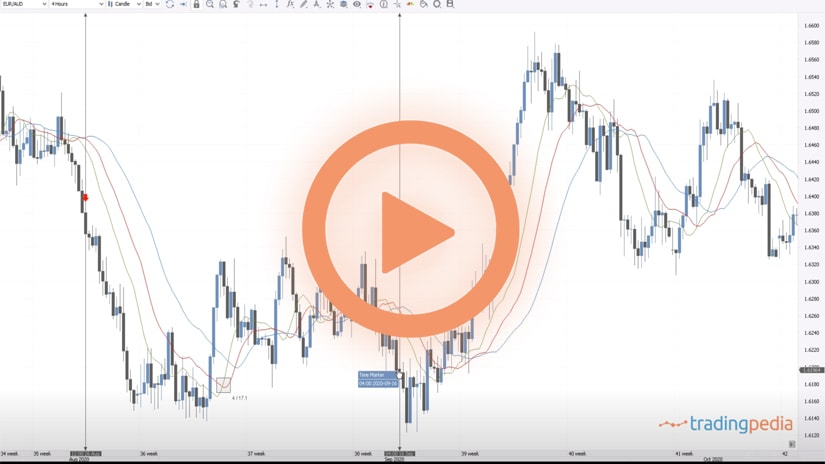
As you can see, the SINE Wave indicator has two lines. But when the two lines intersect ahead of the trending mode, and the trend vs. cycle switches to 1, then this is the place to go on the long side. Pay attention to the fact that the two lines here were in a bullish mode before the upper indicator switched from cycle to trend.
Moving forward, the trend continued and at one point it time the conditions ended with the indicator switching back to 0. So this would be a valid entry with an exit here.
But this does not happen so often, in the sense that where there is not a strong trend coming, the SINE Wave suggests that a range is in place and we may use ranging trading strategies as mentioned earlier.
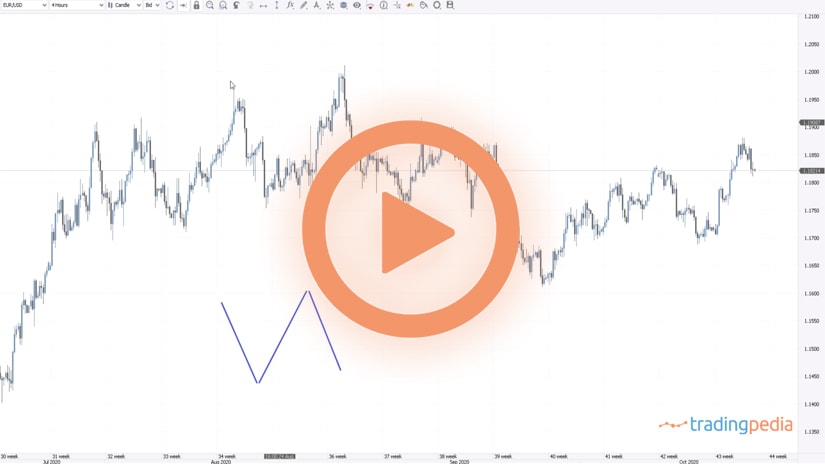
For example, judging by the SINE Wave, this is a bullish condition. But the trend vs. cycle is not moving into trending conditions. So, all this time, for six opportunities, we had ranging conditions, and thus an opportunity to trade overbought and oversold levels using an oscillator – every time the market reaches overbought, sell, and when it reaches oversold, buy. At one point, the market comes into trending mode, and the right approach is to switch from the sell to the buy all the way until bullish and trending conditions hold.
Next, there are no trending conditions here. The SINE Wave turned, and so did the trending conditions here. Even if you traded a range with the SIVE Wave, the market squeezed you here, and when it switched to trend, the way to go is to reverse to the long side to recover the losses and gain some extra. For all this time, the EURUSD provided only opportunities to go on the long side, all the way until the absolute top.
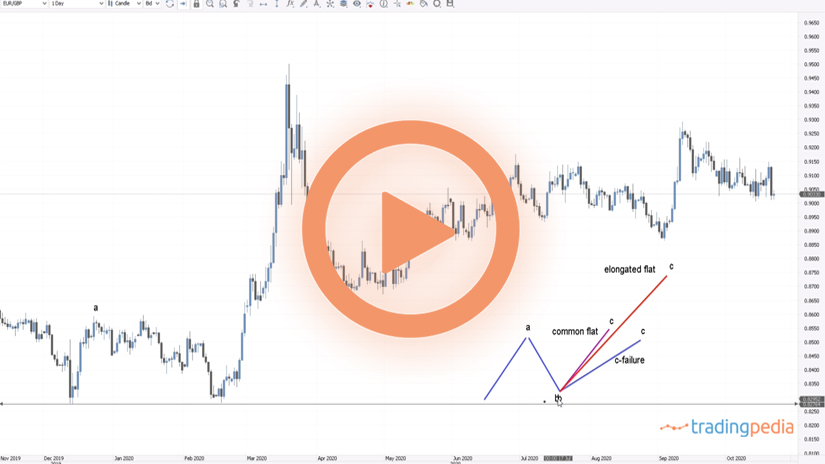
According to Hilbert Transform Trend vs. Cycle, the trend ended right on that day when the EURUSD reached the 1.20 level. This is very important because if you looked at the patterns that the market formed, you can spot a shooting star, or a bearish pattern. Also, the market formed three higher highs, a possible triangle, another bearish sign. If you connect these highs, it shows that the market met dynamic resistance.
Therefore, all these factors, coupled with the fact that the trend mode ended, and we are back into the cycle mode, suggest that the EURUSD here has a hard time to advance and we should exit the longs. Next, we see that the market switched into the cycle mode, and so on.
Related Videos
Conclusion
The trend vs. cycle indicator helps traders identify ranges and trends. One cannot trade with 100% certainty of the move to come – no. There will always be a drawdown. Often, the market moves in the opposite direction from the moment that we enter a trade. But what is important is to be able to recognize the right market move and the correct direction and to react accordingly. This indicator tells you when true trends starts.
Have a great day – bye, bye.