
Hello there, this is tradingpedia.com and this video deals with another Bill Williams indicators – this time an oscillator. This is called the Awesome oscillator and it appears on all trading platforms.
Overview
Therefore, if you have the MetaTrader, for instance, do not despair, as the Awesome indicator appears there too. Even if you do not find an indicator on the MetaTrader, you could easily import it as I showed here on a previous video. This is the MetaTrader and the same oscillator, showing exactly the same values as earlier, only that the oscillator is more visible on this trading platform. Like all oscillators, it is applied on a small window below the main chart.
How to Trade With the Awesome Oscillator
The first thing to know about it is that it plots green and red bars against the zero level. More precisely, when the histogram is positive, a bullish trend is in place. Conversely, when the histogram is negative, a bearish trend is in place.
Even during bullish and bearish trends we may have corrections. As you can see here, this is a correction in a bullish trend – the market corrected but the histogram remained above the zero level. So, if you trade using the Elliott Waves Theory or looking to add on the long side on a pullback, this is one of the indicators to use to add on the long side as long as the Awesome oscillator remains positive. This is where the market turns bearish.
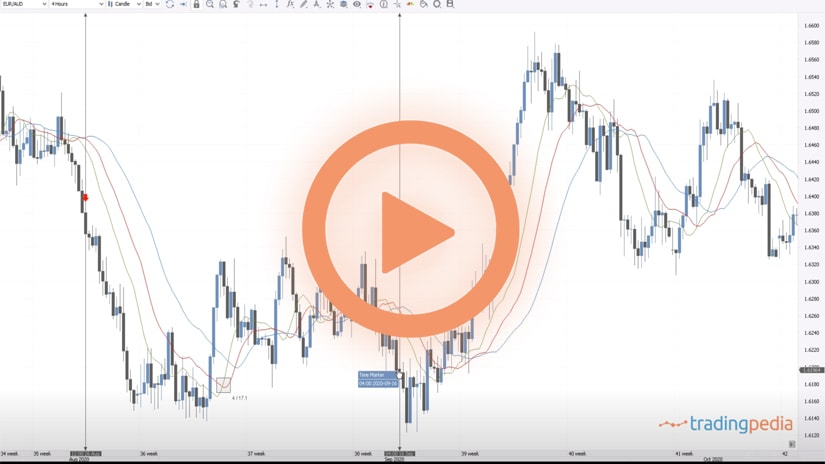
Actually, it shows the rise on the AUDUSD since April 2020 with the coronavirus dip. The Awesome oscillator turned positive and never looked back all the way to 0.71. Normally, you won’t see this kind of strong trends, but the oscillator helps us remaining on the right side of the market. Therefore, as long as the oscillator remains in positive territory, we look only to buy dips and stay with the main trend.
This being a bullish trend, we want to add on the long side. But where and when to do that? The focus is to ignore the bearish candlesticks and focus on the green one. In a bullish trend, if the first green candlestick on the histogram is accompanied by a bullish candlestick on the main chart, this is a bullish sign. Hence, a nice place to add on the long side. What would be the stop loss? Remember, on any trade we need a stop-loss, so when the oscillator turns negative, we close the trade and reverse.
Next, the market forms bearish candlesticks again, and then another long trade appears here. This is the first green candlestick and if we check we see that it also forms a bullish candlestick on the actual chart.
We can ignore the next signal as the candlestick on the chart is indecisive. This should be a long trade but the candlestick on the actual chart does not confirm the bullishness – it is bearish. As such, it is the first signal that the bullish trend might be exhausted. But shorting it here is too risky because the histogram is still positive. Instead, we may choose this place to book the profits on the two long trades.
Next, the market declines, and yet another long signal appears. Then the market forms another bullish signal and at this point in time this candlestick is bearish on a bullish Awesome oscillator and this is the place to exit the longs, not to go on the short side. This way we make the most of this bullish trend – 1.6912 to 1.7159, 1.70 to 1.7154 , 1.7210 to 1.7263.
And then the AUDUSD fell, the Awesome oscillator turned negative and we check the candlestick on the main chart. Is this bearish? No. This is a bullish candlestick, and it signals that it is not the time to go on the short side.
Related Videos
Conclusion
This is how to trade with the Awesome oscillator – a powerful oscillator and not so many people know how to use it.
Have a great day – bye, bye.