
Hello there, this is tradingpedia.com and this video deals with one of the Bill Williams indicators. If you are not familiar with these indicators then you should know that this guy is responsible for a handful of indicators, available on all trading platforms.
Overview
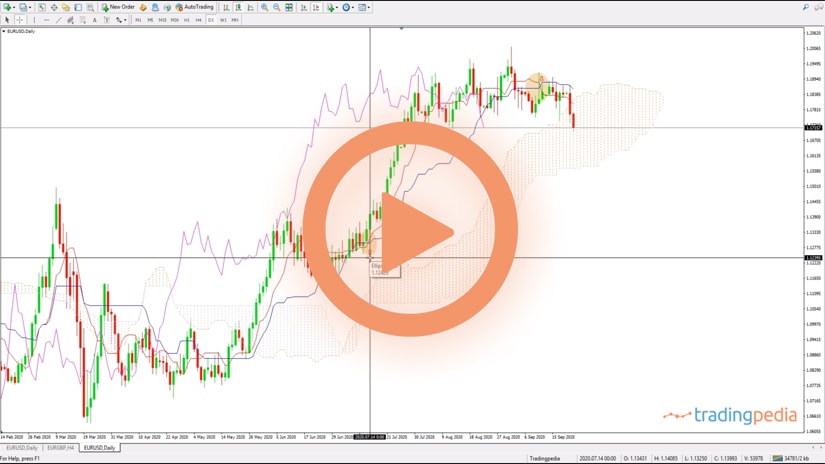
One of them is called the Alligator – a funny name to a serious trend indicator. As such, it appears on the chart. The Alligator has three lines, or averages – these blue, red and soft green lines. Even the lines have funny names – jaw, teeth and lips. By the time that the price enters this area the trend is not in place anymore.
Why is this indicator useful? First of all, it is not repainting. Many indicators repaint, meaning that by the time that one candlestick closes and others open, you will see that the indicator changes the position. In this case, it doesn’t. this is a valuable tool or characteristic to look for in any trading indicator, not only in this one.
Trading With the Alligator Indicator
Moving forward – how to trade with it. It is useful in showing trending conditions. It is very visible and when the three lines are aligned like this, it means a trend is in place. The key to interpret when trading with the Alligator indicator is not only when to enter the market, but also when to exit.
This is the EURAUD 4h chart and it goes up and down without any direction. The idea here is to trade a so-called perfect order between the three lines of the Alligator. Namely, when the price is not reaching any of the three lines, it means that a trend is in place and we want to be part of that trend.
The Perfect Order
Therefore, we look for the moment that the Alligator posts the perfect order. If the price closes below the Alligator, it is still not too late to go on the short side, even though the price is far from it. The idea is that if you go short here, the worse it can happen is that the market bounces, but it will try for a new low before reaching the Alligator’s lines. In this case it was a nice trade going short here 1.6354 all the way to this place when the fast moving average crosses the medium one. This is where the conditions are not in place and therefore it represents the closing point.
Is this a good place to go on the long side? The answer is no, because the candlestick touches the Alligator. Make a comparison between this one and this one – this candlestick does not touch the three lines of the Alligator, but this one does. Therefore, this is a false signal, and we should ignore it.
Moving forward, there is no perfect order all the way until this moment on. Here, we see that the candlestick does not touch the Alligator. Therefore, it represents a valid point to go on the short side. The market did fall from 1.6189 all the way to 1.6120 so 60 pips to the downside, comes back to the Alligator, a bullish sign, tries to make a new low and closes into the Alligator. This is the moment when we should close the short trade as it invalidates the short trade.
Then the market formed bullish conditions. Is it possible to buy here? Yes, because the candlestick does not touch the Alligator lines and they suggest that a strong trend is about to follow. The trend started 1.6289 and the market went all the way up to 1.6588.
The next signal appears here, the market reverses, tries for a new low, but after it touches the candlesticks. Moreover, it forms a hammer pattern here, goes into the Alligator, so this is the place when we exit. Similar things we can see in the instances the follow.
Related Videos
Conclusion
To sum up, the Alligator is a Bill Williams indicator. Also, it is a trend indicator. Moreover, it is formed out of three lines and when the lines form a perfect order we want to buy or sell if the candlesticks do not tough the lines. If after the entry the market reverses and touches the lines, that is a reversal pattern, so we should look for exit.
Bye, bye.