
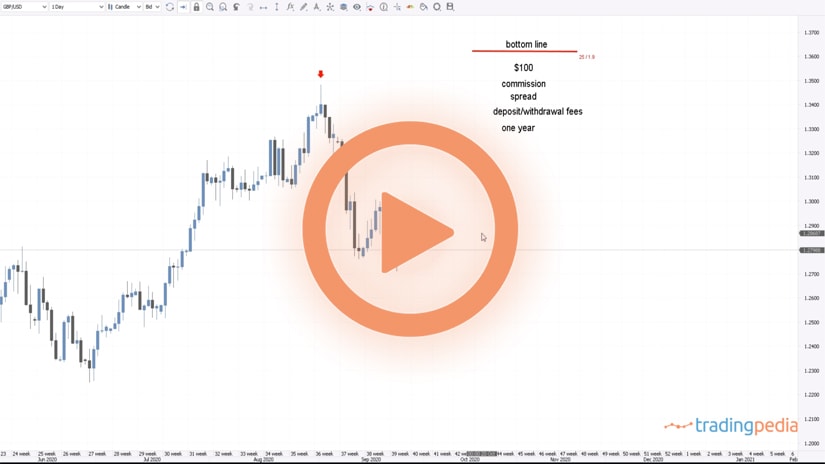
Hello there, this is tradingpedia.com and this video deals with contracting triangles. More precisely, with the apex of a contracting triangle – what it is and how can we use it in trading.
Before starting, contracting triangles appear everywhere. Whenever you see a consolidation, the chances are that the market forms a contracting triangle.
Rules of a Contractiong Triangle
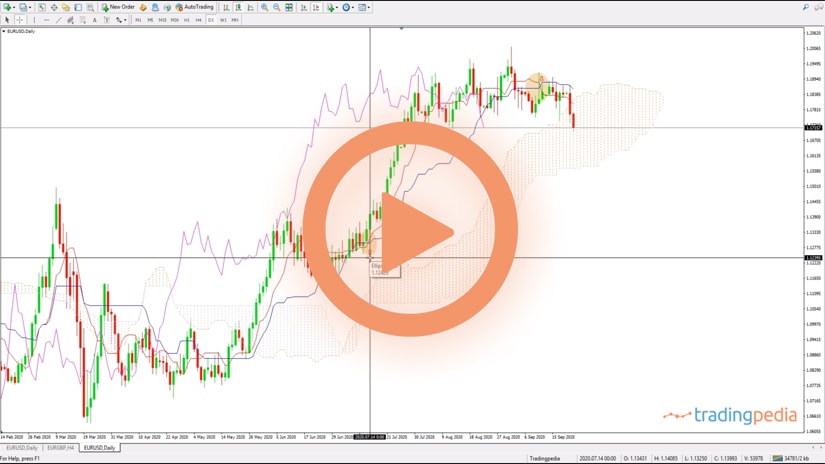
This is the 4h chart on the EURUSD and before looking at some examples on this pair, let’s set the rules of a contracting triangle and how to find its apex. A contracting triangle has no more, no less than five legs or segments, labeled with letters in the Elliott Waves Theory a-b-c-d-e.
The apex of a contracting refers to the common point or intersection point between the two trendlines that define the triangle. To find the apex, we must find the intersection point between the a-c and b-d trendlines. Where the two trendlines meet on the right side of the chart, that is the apex of the contracting triangle and has powerful implications in technical analysis. This notion of an apex of a contracting triangle does not belong only to contracting triangles, but also to expanding triangles. The difference is that in expanding triangles the apex forms on the left side of the chart.
The Apex of a Contracting Triangle
Why would then anyone care about an apex on the left side of a chart when technical analysis focuses on finding levels on the right side of the chart? The explanation is that the apex of a contracting triangle, especially the one of a limiting contracting triangle, offers important support and resistance levels for future price action.
By the time that the triangle breaks the b-d trendline it means that the triangle is over. When it comes to the apex of the triangle, the tendency is that the price will react strongly. Once support is broken, it transforms into resistance, and once resistance is broken, it transforms into support.
Related Videos
Example
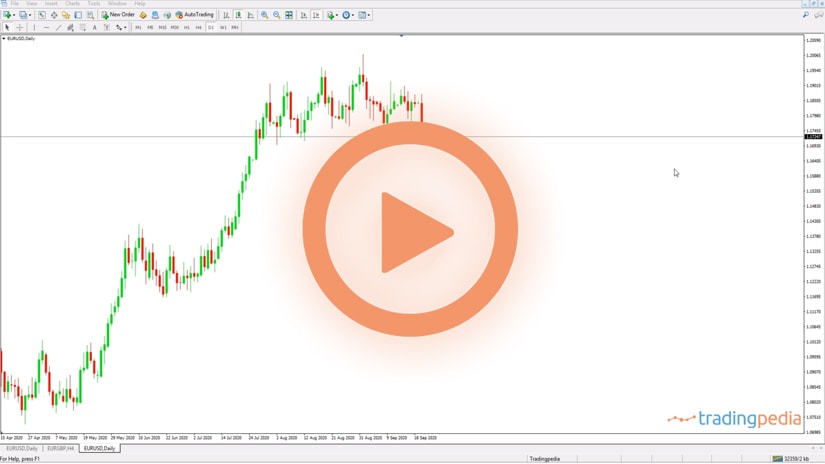
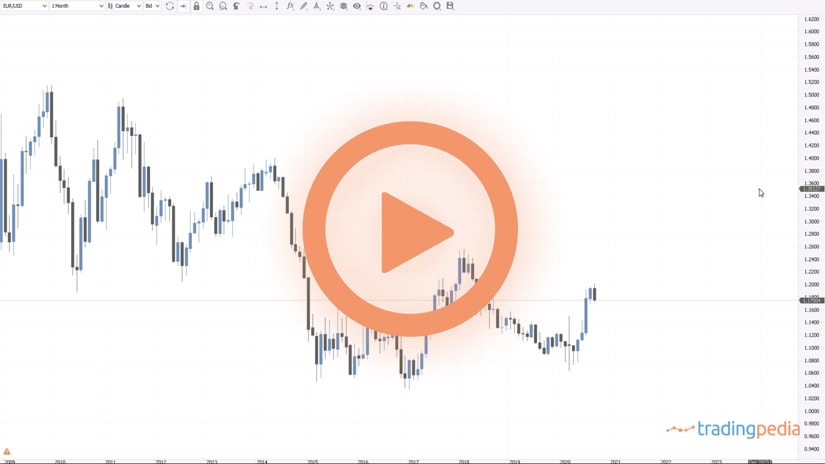
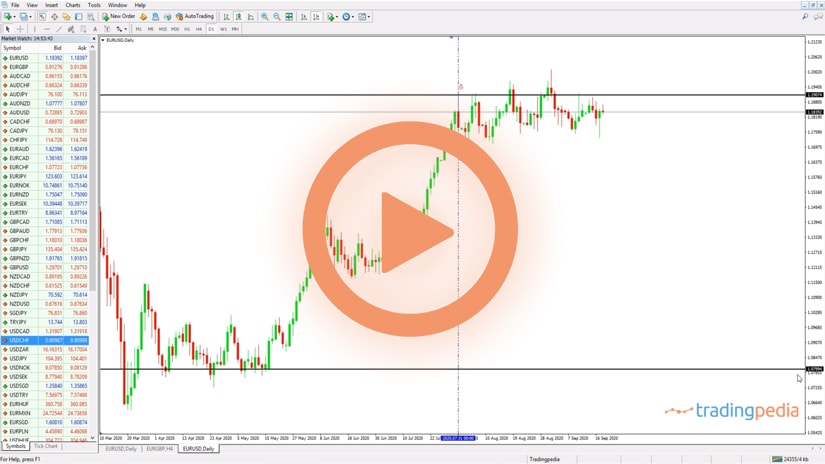
Let’s have a look at the EURUSD – this is the 2020 price action on the pair. We see an aggressive move higher on the EURUSD from the moment that it started the year.
After January 2020 it formed a contracting triangle defined by the series of lower highs and higher lows until it broke higher. This is the moment when the triangle broke higher and literally the pair did not look back all the way until one week ahead of the US elections – the most important USD event moving forward.
If we are to use the rules of a contracting triangle and the apex of a contracting triangle as discussed earlier, this would be our wave a, this the b-wave, here the c-wave, and at this point in time we can already connect the a-c points so as to find the a-c trendline. This is the d-wave and the focus at that point in time, was to see if the triangle is part of complex correction as it will act as a reversal pattern.
If this was the a-c trendline, this must be the b-d one. On any contracting triangle, the focus sits with the b-d trendline because by the time the price breaks it, it means that the triangle ended. If you go back and check other videos that we have here on tradingpedia.com you will see that the rules of a contracting triangle state that the e-wave must break the b-d trendline in less than the time that it took the e-wave to form.
That makes the break here valid, so bulls probably already bought here. However, an even better place to go long is to use the apex of a contracting triangle. In my view, it is equally important to correctly draw the b-d and a-c trendlines as to find the apex.
Look at this apex – where the two trendlines intersect. When the market came to this apex, this is the ideal place to go long. Of course, one might say that it doesn’t quite matter because if you go long on the b-d break, you still have a good risk-reward ratio ahead. I agree, but my point with this video is that by using the apex of a contracting triangle you can find important support and resistance levels and they result in much better risk-reward ratios, as seen in this example.
Thank you for being here. Bye, bye.