
Hello there, this is tradingpedia.com and this video deals with flats with a weak b-wave, as a continuation to the previous one. We have described so far what are the conditions for a flat pattern – the b-wave to retrace more than 61.8% of wave a and, depending on its length, we have three categories of flats.
Overview
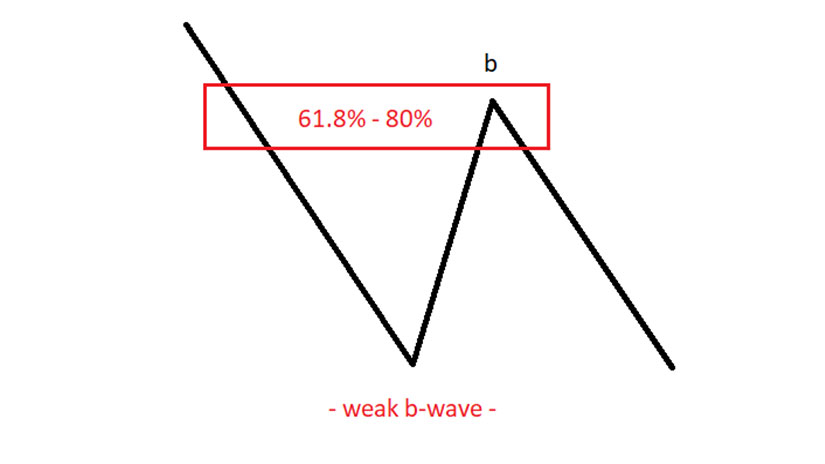
 The first categories, drawn here, is called flats with a weak b-wave. It means that the b-wave retraces between 61.8% and 80% of wave a. As you can see the Fibonacci numbers are all over the place when it comes to the Elliott Waves Theory, and this is something to remember when it comes to your understanding of the theory.
If we have a bearish trend, and the market retraces with wave a, and then the b-wave retraces between 61.8% – 80%, then this category belongs to flats with a weak b-wave. In this category we have three possibilities, based on the c-wave’s length.
Flat With a b-failure
 If the c-wave fully retraces the previous b-wave, or takes the highs in wave a, like this, this is called a flat with a b-failure. What does it mean? The inability of the b-wave to retrace more than 80% is the failure. Every time you will here the word failure when it comes to flats, it represents countertrend market strength. Therefore, if this is a flat with a b-failure and the market goes like this with the c-wave ending between 100%-138.2% of the previous b-wave, the pattern shows countertrend strength.
Elongated Flat
 Another type of flat that it might form when the b-wave fails to retrace more than 80% of wave a is a very strong c-wave that exceeds 138.2%. This is called an elongated flat – the market elongates. During such a pattern you will see that usually it signals a contracting triangle.
Flat With a Double Failure
 The last type of flat that belongs to this category is a flat with a double failure. One failure is when the b-wave fails to retrace more than 80% of wave a and another one is when the c-wave fails to fully retrace the b-wave.
In this case, two failure form and in this pattern, you will have the c-wave as the most time consuming. This is one of the most powerful patterns, because, as mentioned earlier, whenever you here the word failure, that shows countertrend strength. But in this case, there are two failures – the b-wave that fails to retrace more than 80% and the c-wave that fails to fully retrace the b-wave.
A flat with a double failure will usually have for the c-wave a terminal impulsive wave and not a classic one. In the case of a terminal impulsive wave, it is still labeled 1-2-3-4-5 but all the waves are corrective and not impulsive.
To sum up the types of the flat, based on the retracement of the b-wave, three types of flats exist. One is when the c-wave retraces between 100%-138.2%, another one is when the c-wave retraces more than 138.2% and often beyond 161.8% and when the c-wave fails to fully retrace the b-wave.
Related Videos
These are three types of flats, very common with the Elliott Waves Theory. Moving forward, we will discuss another category with other types of flats plus a running flat.
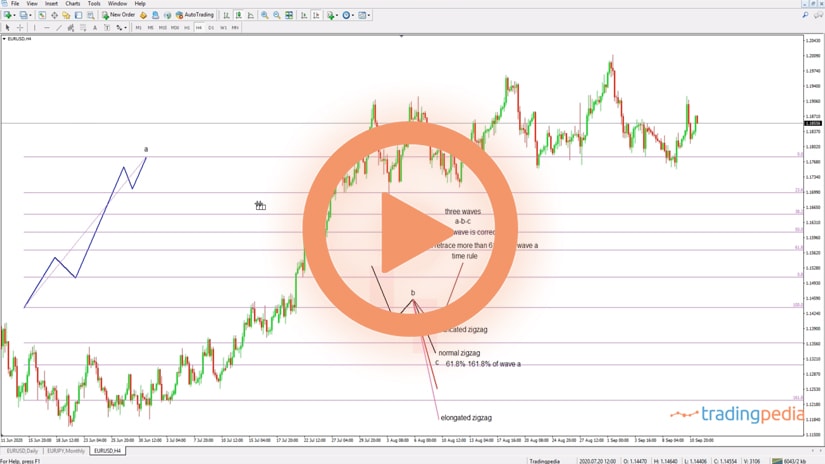
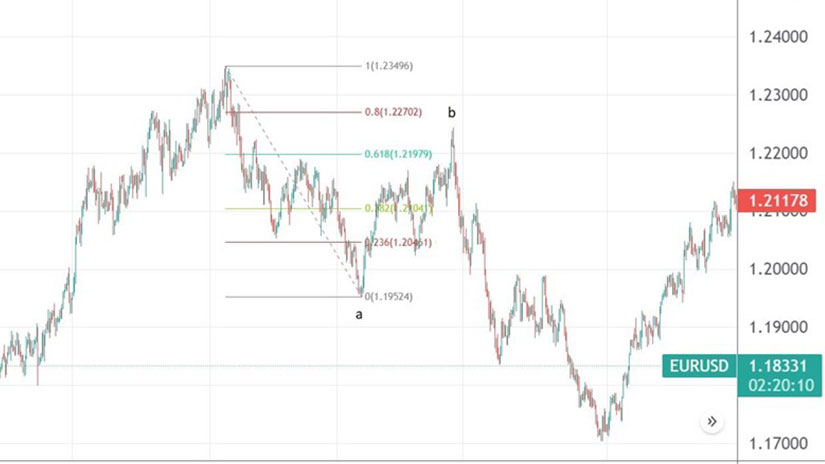
On this EURUSD chart, if this would be wave a, let’s assume that this would be the b-wave. If we use a Fibonacci retracement to find out the minimum retracement level for the b-wave, we see that it retraced between 80%-100%. It means that the market forms a flat with a weak b-wave. But if the c-wave that followed ended somewhere around here, it would be a flat with a double failure, showing countertrend strength. If it ended between 100%-138.2%, the market would have formed a flat with a b-failure, still showing countertrend strength.
Therefore, it is very important to know what kind of pattern the market forms, were does the flat fits in the overall picture and how to interpret it.
Examples of Flat Patterns with a Weak B-Wave
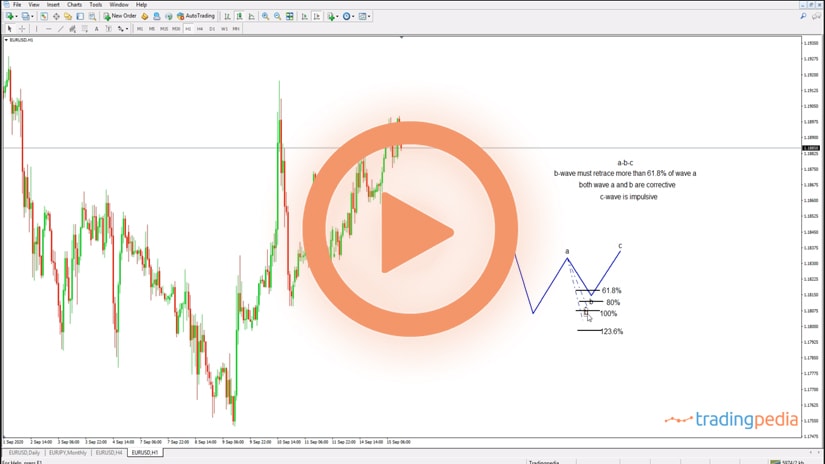
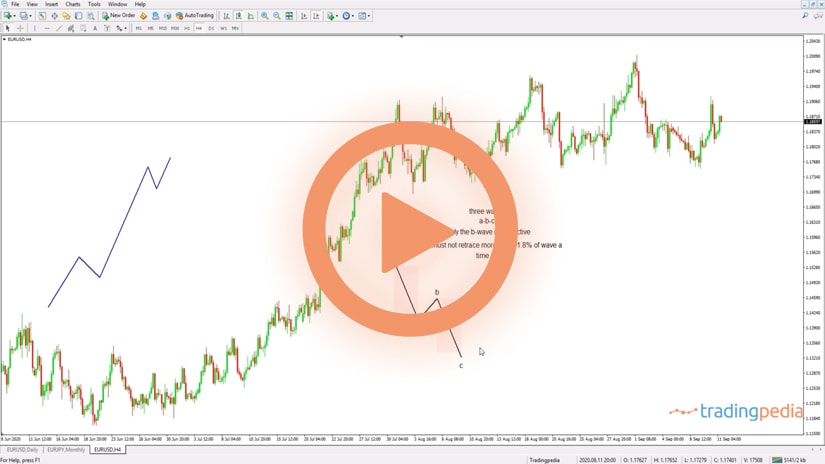
 Flat patterns are, therefore, three-wave structures labeled with letters: a-b-c. The c-wave is the only impulsive segment, and the key to characterizing a flat pattern is the b-wave’s length.
As mentioned earlier, in the weak b-wave category, we can find three types of flat patterns – flat with a b-failure, flat with a double failure, and an elongated flat.
What Makes a Flat with a Weak B-Wave?
 It is all about the end of the b-wave – it must be between 61.8% and 80% retracement of wave a. Anything more than 80% leads to a different category. Anything less than 61.8% leads to a different pattern other than flat.
A couple of things should be mentioned here before anything. First, the name of this category comes from the inability of the b-wave to retrace more than 80% o wave a. This is what makes it weak.
Second, the b-wave is a corrective wave. It could be simple or complex. If it is a simple correction, it can be another flat of a lower degree or a zigzag – it cannot be a triangle.
But if it is a complex correction, it may end with a triangle. Therefore, traders should concentrate on the end of the triangle, which marks the end of the b-wave. In other words, parts of the b-wave may stretch beyond the 80% retracement, but what matters is that the b-wave ends between 61.8% and 80%, as shown above.
EURUSD Formed a Flat with a Weak B-Wave at the Start of 2021
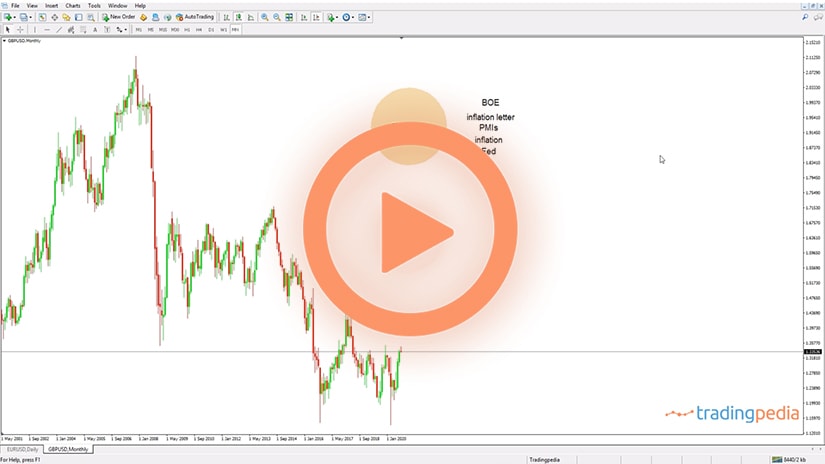
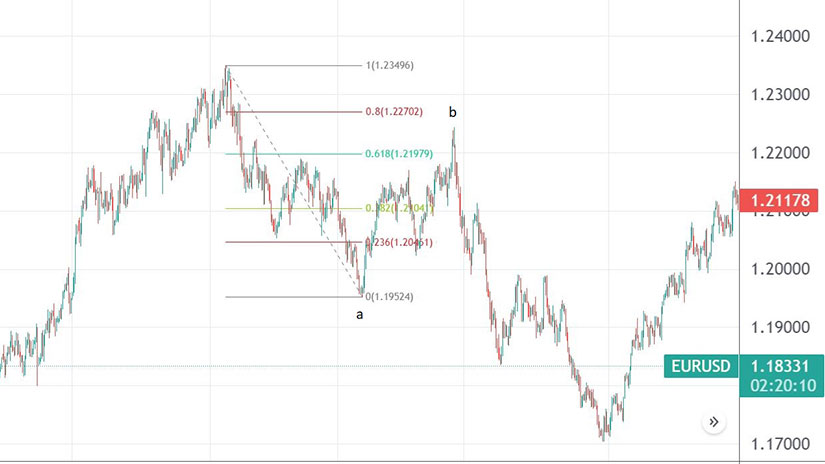
 The EURUSD currency pair started the trading year at its highs. It opened the year above 1.23, but it fell ever since. It dropped over six big figures, or six hundred pips, in the first months of the year.
But the decline was not impulsive but corrective. Moreover, the move that followed was strong enough to retrace beyond 61.8% of the initial decline, but less than 80% of it. Thus, the EURUSD formed a flat with a weak b-wave to start the trading year.
This is how we define the category. The next question to answer is what type of a flat the market formed – b-failure, double failure, or an elongated flat?
The type of a flat tells us more about the price action that follows the pattern. For example, a “failure” signals countertrend strength. Moreover, a double failure is an even more powerful contrarian signal. Finally, an elongated flat indicates more corrective waves to follow, as they form either a segment in a triangle or a terminal impulsive wave.
Scenarios Based on the C-Wave’s Length
 In any flat pattern, the b-wave’s length tells us the category the flat belongs to. That’s it – the minimum condition for a flat pattern is to retrace beyond 61.8% of wave a.
But the Elliott Wave trader must use the c-wave’s length to find out the type of flat in this category. Three types exist, based on the c-wave’s length. First, traders use the c-wave’s length and compare it to the b-wave. The focus is on the following levels: the c-wave is shorter than the b-wave, it has a length between 100% and 123.6%, or it is longer than 123.6% when compared to the b-wave.
The three possibilities are shown on the chart below, numbered based on the possible length for the c-wave.
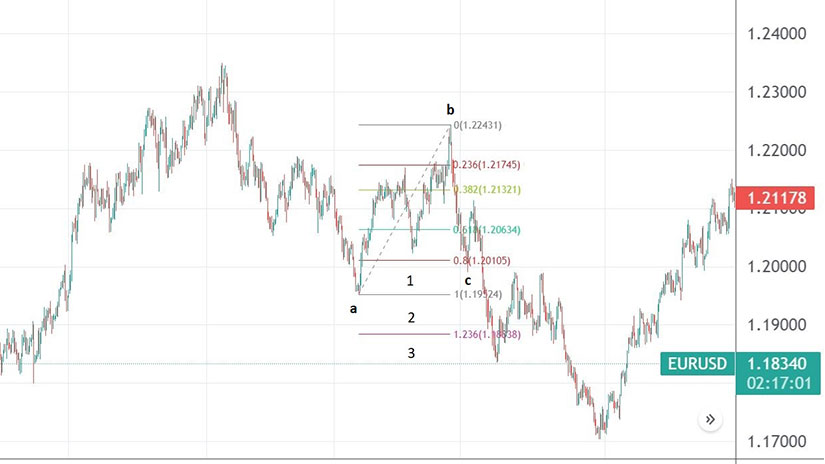
First Possibility – Flat with a Double Failure
 The first possibility to consider is that the c-wave fails to fully retrace the b-wave. In this case, it is said that the market formed a flat with a double failure.
Why a double failure? First, the b-wave retracement ended between 61.8% and 80% of wave a. That is one failure to consider. Second, the c-wave fails to completely retrace the b-wave. Hence, a double failure.
Second Possibility – Flat with a B-Failure
 The second type of flat belonging to this category is called a flat with a b-failure. As explained earlier, when the b-wave fails to retrace more than 80% of the previous wave a, the market forms a failure. But for a flat with a b-failure there is one more requirement to consider. That is, the length of the c-wave. It must end between 100% and 123.6% when compared to the b-wave.
In our EURUSD example, that is not the case. The market dropped further, well beyond the 123.6% level, meaning that the pair did not form a flat with a b-failure. The only other option left is an elongated flat.
Third Possibility – Elongated Flat
 It became clear by now that elongated flats have the longest c-wave out of all the flat patterns. Its length must exceed 138.2% and very often it stretches well beyond 161.8% of wave b.
Elongated flats form in all three categories of flats, not only in the ones with a weak b-wave. Their main characteristic is that they suggest the presence of a possible triangle forming on larger timeframes.
In the case of the EURUSD example, the market formed an elongated flat pattern. The c-wave is much longer than 161.8% of the b-wave’s length and thus suggests that the entire flat pattern is part of a triangle on larger timeframes. Elongated flats form as part of a leg of a contracting triangle or even the entire segment of a triangle. Also, they may appear as part of a terminal impulsive wave, unique impulsive waves discovered by Ralph Elliott.
These are the only types of flats belonging to this category. The key thing to remember here is that the c-wave is the one that determines the type of the flat. Also, if a flat has at least one failure, it signals countertrend strength. Therefore, the flat with a double failure is a powerful signal of countertrend strength, and it typically forms as the second wave in an impulsive move.